Markov Chain Visualisation tool
Markov chains are mathematical models which have several applications in computer science, particularly in performance and reliability modelling. The behaviour of such probabilistic models is sometimes difficult for novice modellers to visualise. The objective of this project is to provide the user with a tool which dynamically displays the behaviour of a small Markov chain, using colours to show how the probability mass is distributed over the state space. The changing distribution will be reflected by the changing colours of the display. Specification of the chain should be via a graphical interface. The tool should also calculate useful measures on the chain; for example it should allow the user to choose specific states and then calculate first passage times.
Fourth year Computer Science project by Phil Hooker (undergraduate) the University of Edinburgh UK.
This document is split into several sections
- Background
- What does it do
- User manual
- the tool internet explorer/netscape 6.x or netscape communicator (needs latest Java runtime environment from sun available here)
- Feedback
- System design
What is a Markov chain?
Markov chains are mathematical models; in computer science they are used to model systems in order to gather information on performance and reliability. There are two types of Markov chains, discrete and continuous; discrete models operate fixed time steps using probabilities, and continuous operate over all time using transition rates.
The system will only be used to model small Markov chains, so the best way to represent them visually is as a state transition diagram.
Discrete Markov chain Example
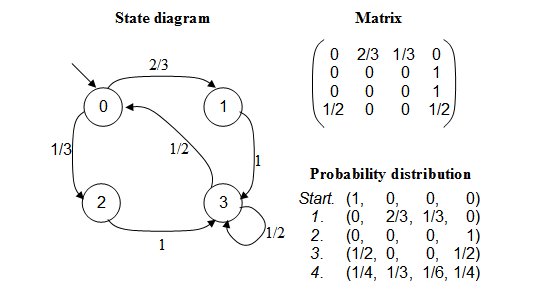
From a state diagram a transitional probability matrix can be formed (or Infinitesimal generator if it were a Continuous Markov chain). This is how the Markov chain is represented on the system.
A probability distribution is the probability that given a start state, the chain will end in each of the states after a given number of steps. During the simulation the state transition diagram is displayed and the probability distribution shown on each state. To animate colours are shown representing the probability distribution. For example a state with a high probability distribution would be coloured dark blue, and one with a low distribution light blue.
Description of project
The objective of this project is to develop a tool which allows users to graphically specify a Markov chain, then animate the behaviour of the chain, in such a way as to convey useful information about the state probability distribution.
The tool enables a user to specify a Markov chain by creating and dragging
states onto a canvas, then to click and drag links between the nodes. The
links can then be given values that in a continuous Markov chain would
represent rates in the system, and in a discrete Markov chain would represent
probabilities.
Once the chain has been created, and a start state specified, the system then verifies it if it is a Discrete Markov chain. If it is a continuous Markov chain, it is discretized (converted into a discrete Markov chain) and this discrete Markov chain is then verified. If it is not correct, it returns to the design screen highlighting the unbalanced node(s).
If verified, the chain is displayed and from the starting state, the probability distribution on each node is represented in the form of colours. There are then several different methods to analyse the chain. One such option is to animate the probability distribution for a specified number of steps at a time, but halting if the system reaches a steady state (where the probability distribution no longer varies with time as the system settles into a regular pattern of behaviour). In addition, as an extension to the project, analysis tools have be added to provide more information about a specified chain.