Slice Reconstruction
Radon Transform
The Radon transform of an image
represented by the function f(x,y) can be defined as a series of line
integrals through f(x,y) at different offsets from the origin. This is
shown in Figure 1 and defined
mathematically as:
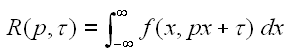
where p and tau are the slope and intercepts of the line.
A more directly applicable form of the transform can be defined by
using a delta function:
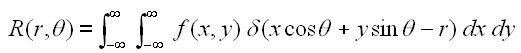
where theta is the angle of the line, and r is the perpendicular offset of
the line.
Figure 1
Radon
Transform
The acquisition of data in medical
imaging techniques such as MRI, CT and PET scanners involves a similar
method of projecting a beam through an object, and the data is in a
similar form to that described in the second equation above. The plot
of the Radon transform, or scanner data, is referred to as
a sinogram due to its
characteristic sinusoid shape. Figure 2 shows a simple
non-homogeneous shape and the sinogram created by taking the Radon
transform at intervals of one degree from 0 to 180 degrees.


Figure
2
A simple image (left)
and the sinogram (right) produced by applying the Radon Transform.
Inverse Radon Transform using Filtered Back Projection
To reconstruct the image from the
sinogram, the inverse Radon transform
is applied to the image. There are several techniques by which the
inverse transform can be calculated but the most
common is Filtered Back Projection.
The filtered back projection
algorithm is split into two phases, filtration and projection.
Projection
The projection phase is very similar
to the Radon transform described above, and shown in Figure 1 except now the line
integrals are projected back onto the plane at their respective angles.
The projection phase of the Filtered Back Projection, using the data
format described above:
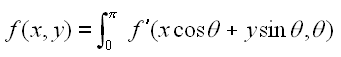
where f' is the filtered data.
A common discrete approximation of this is:
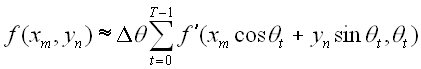
This equation can be used to determine
the pixel values at a given point. The exact values depend on the
chosen interpolation method, e.g. nearest-neighbour, linear
interpolation etc. As more projections are added, the quality of the
reconstruction will increase. Figure 3 shows the box shape
reconstructed using 18 projections. This is clearly not enough to
accurately reconstruct the image, but the individual projections can be
seen.

Figure 3
Box reconstructed using 18 projections
Filtration
Figure
4 (left) shows the result of the back
projection algorithm applied as described and using all available data.
Although the shape of the reconstructed object
can be seen, the reconstructed image is heavily blurred. To counteract
this effect, a high pass filter is applied to the sinogram data in the
frequency domain. This is achieved by applying a 1-D DFT to the
sinogram data for each angle, multiply by the filter, and then using
the inverse DFT to reconstruct the data. The simplest form of high pass
filter is a ramp. Applying the ramp filter significantly improves the
quality of the
reconstructed image, Figure 4 (right).
However, because the ramp filter emphasises high
frequency components of the image, it can cause unwanted noise. To
counteract this, several other high-pass filters are commonly used. A
selection of these are shown in Figure
5. See the reference for a full discussion, including
derivations, on the use of filtration.


Figure 4
Reconstructed images: unfiltered (left) and ramp filtered (right)
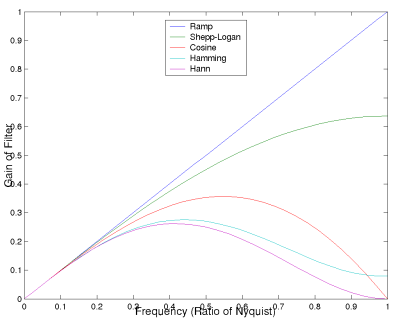 Figure 5
Filter windows
As a more realistic demonstration of the back projection algorithm Figure 6 shows a reconstruction
based on real medical
data. The image on the left is the sinogram obtained from the scanner,
the right is a false colour image of the skull reconstructed from this
sinogram. The Hann window was used during the filtration step.
Figure
6
Example of filtered back projection applied to
medical data.
References:
Peter Toft: "The Radon Transform
- Theory and
Implementation", Ph.D. thesis. Department of Mathematical
Modelling, Technical University of Denmark, June 1996.
Image credits:
Radon transform diagram from MATLAB online documentation http://www.mathworks.com/access/helpdesk/help/toolbox/images/radon.html
Sinogram of skull from
http://www-rcp.ijs.si/~zdravkok/int_fbp/int_fbp.htm
Brendan
F. Hayden
10/02/2005


