Sea Ice Detection
by Kathrin Rösner
While icebergs, glaciers and ice sheets are formed on land, sea
ice is just frozen ocean water. The amount of sea ice in the oceans
increases during winter and decreases during summer while some sea
ice exists all year in some regions. During some part of the year,
approximately 15% of the oceans are covered by sea ice. [Source: http://nsidc.org/seaice/intro.html ]
table of contents
Sea ice is important because of various reasons, and the
influences of sea ice aren't restricted to the polar regions in which
sea ice usually occurs. In fact, sea ice has big influence on the
global climate system since its bright surface reflects much sunlight
back into the atmosphere, keeping the temperature low in sea ice
areas. If much sea ice melts, the affected areas absorb more solar
energy and have therefore higher temperatures that melt even more
ice. As a result, the polar regions are extremely sensitive to global
climate changes and are good to detect and measure climate
changes.
Additionally,
the salt that the sea ice emits influences the ocean's global water
circulation. Changes in the sea ice coverage can have an impact on
the ocean circulation and can even lead to global climate changes.
Of course, sea ice can cause problems
for ships, for example for routes through the Northwest Passage or
for oil ships that are travelling through sea ice areas. The sea ice
detection as described below is used to deal with this problem. [Source: http://nsidc.org/seaice/intro.html
, more info available at http://nsidc.org/seaice/environment/global_climate.html]
table of contents
Remote sensing is defined as
getting information about an object without physical contact. For the purpose of detection sea ice in order to improve navigation, active remote microwave sensing is usually used. This means that a sensor on a satellite or on an aircraft emits microwave radiation (therefore "active"). The ground reflects the microwaves - depending on the kind of reflecting material, the reflected radiation has different properties. The sensor system measures this and computes an image of the surface.
Usually the term "remote sensing" refers to the usage of electromagnetic radiation from space or from an aircraft. Passive remote sensing refers to measuring radiation that an object emits naturally. But since this energy is relatively low, passive remote sensing cannot be used for measuring sea ice in a detail that is neceessary for ship navigation. In contrast to that, active
remote sensors observe radiation that the sensor itself generated.
Therefore, this article focusses on active sensors. [Source: Remote sensing of Snow and Ice]
table of contents
Aerial photography and electro-optical systems that
operate in the visible and near-infrared region have problems with
cloud coverage.
This is an important drawback because a series
of temporal consecutive images of a very large area is needed for
measuring and recording climate changes. Therefore, the most common
sea ice detection techniques are based on microwave radiometry since
they are not dependent on daylight or on a cloud-free sky.
Additionally, the microwave radiometry is usable for global
coverage. [Source: Remote sensing of Snow and Ice]
Real Aperture Radar (RAR) (on board of satellite
OKEAN)
Problem: two objects in the azimuth (= along-track)
resolution will be measured as a single, larger object if they are closer to each other than the radar beam-width.
Real aperture
azimuth resolution = H * wavelength / .(length of the antenna *
cos(incidence angle) )
In order to obtain a better azimuth
resolution, a shorter wavelength is needed or a longer antenna. Long antennas are in the best case expensive and in the worst case not
long enough, since a needed antenna length of 4.6km is possible
(calculation with nominal values: wavelength = 5cm, platform height = 800km, incidence angle = 30°). On the other hand, shorter
wavelength are subject to higher attenuation due to clouds and
atmospheric conditions. Therefore, the resolution is very dependent
on the height, and RAR is usually used for airborne systems though
there are some spaceborne systems like the satellite OKEAN.
The
SAR was developed in order to overcome these restrictions.
[Source: http://earth.esa.int/applications/data_util/SARDOCS/spaceborne/Radar_Courses/Radar_Course_II/real_aperture_radar_azimuth_resolution.htm ]
Scatterometry (onboard of satellite QuickScat)
Just
like SAR, scatterometers are active remote sensors that can be used
on airborne or spaceborne systems. But a scatterometer places less
emphasis on high spatial resolution than a SAR, and focusses on high
radiometric resolution. Usually, but not always, a scatterometer
uses more than a single antenna in order to determine the angular
dependence of the backscattering coefficient more precisely. The QuikScat is an example for a satellite that carries a scatterometer onboard. [Source: Remote sensing of Snow and Ice]
SAR
SAR stands for
'Synthetic Aperture Radar'. It is an active microwave remote sensor.
That means it is a remote sensor that actively emits microwave radar
and obtains its images by measuring the backscatter. It can be
airborne or spaceborne. Please see the next paragraph for a detailed description of its concept.
table of contents
|

Beaufort
Sea, north of Alaska. Picture taken by RADARSAT.
The dark lines that
are merged with the sea ice are leads that are covered with no or
with thin ice. The brighter colours come from multiyear ice
floe.
[Source: http://nsidc.org/seaice/study/active_remote_sensing.html]
(Image courtesy of NASA JPL,
University of Alaska–Fairbanks.)
|
|
![Source: http://www.asf.alaska.edu/about_sar/faq.html#saperture]()
|
A SAR, no matter if it is airborne or spaceborne, emits
microwave radiation. This radiation gets reflected from the ground
in different ways, depending on the reflecting material. It is easy
to distinguish between open water and sea ice since the microwave
emissivity of sea ice differs significantly from that of open water.
SAR measures the backscattered power of the reflection and creates
an image like image above.
Since a longer antenna improves the
resolution of the image, and long antennas are quite expensive, the
SAR uses the movement of the vehicle and complex processing
techniques in order to simulate a larger antenna. The SAR emits
several impulses while travelling over a specific object. Due to the
movement of the vehicle relative to the ground, the frequency of the
reflected impulses are shifted. This is called doppler effect.
During a complex calculation, the SAR processor uses reference
doppler-shifted frequencies and the actual doppler-shifted reflected
radar waves in order to match the reflected waves with the correct
object. Thus, the SAR processor creates an image that looks like it
was derived from the data of a far larger antenna than the SAR
actually had. The term 'synthetic aperture' in SAR refers therefore
to the distance that the vehicle moved while its radar antenna
received the reflections of a single
object.
[Source: http://www.asf.alaska.edu/about_sar/faq.html#saperture], more info available from this NASA website
table of contents
Techniques for improving SAR
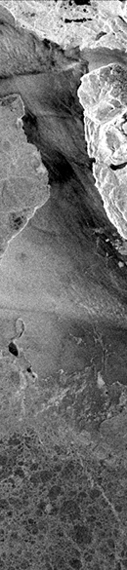
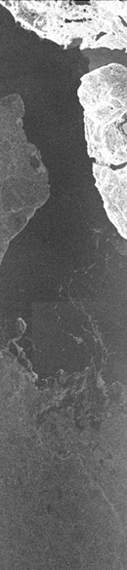 Polarimetry
Radar waves are polarized, and different materials reflect just
radar waves with a specific polarization, some materials even change
the polarization of the incoming radar wave while reflecting it.
Therefore, emitting radar waves with different polarizations lead to
different images with different included information which can be
combined. An example for this can be seen in the images on the right
side, which shows the west coast of Newfoundland on April 1994 in HH
(leftmost) and HV (middle) polarization. Both images were obtained
by the Spaceborne Imaging Radar-C mission that
carried a SAR on board of a space shuttle.
The same polarizations can be obtained by the spaceborne RADARSAT -
systems. [Source: http://www.radarsat2.info/application/ice/cs_seaice.asp]
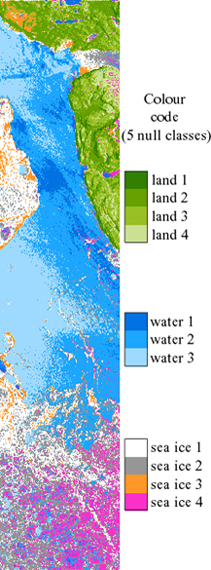
Classification
It is
possible to classify data like the one from the above mentioned
images. This was done in the leftmost picture by using Maximum
Likelihood classification. The rightmost image is the result of a
H/A/a Maximum Likelihood classificator after five iterations.
[Source: http://www.radarsat2.info/application/ice/cs_seaice.asp ]
Interferometry.
The
basic idea is comparing two different SAR images of the same area
from slightly different locations, obtaining the phase informations.
The phase differences between the images are considered to be
totally due to the geometrical differences. With this assumption,
the exact geometric surface can be determined.
This technique
optimizes the precision of a SAR – geometrical data and bulk
translation of solid surfaces are accurate up to the order of a
centimetre, the topography is precise up to the order of a meter.
But this technique requires hi-tech on the side of the SAR-operating
system and on the side of the user who processes the SAR-data. [Source: Remote Sensing of Snow and Ice]
See
the InSar
fact sheet of the U.S.Geological Survey or an Physics Today
article named 'InSar,
a tool for measuring Earth's surface deformation' from Matthew
E. Pritchard, Department of Earth and Atmospheric Sciences at
Cornell University, USA (July 2006)
table of contents
Imaging radars like SAR are subject to a specifying viewing
geometry. This geometry causes a number or geometric and radiometric
interferences in areas with a considerable relief. These
disturbances can be corrected if a proper digital model of the area
is available.
SAR uses coherent radiation. This causes a characteristic
noise called “speckle”. Speckle worsens the radiometric
resolution. A list of literature about speckle reduction can be
found at http://www.gi.alaska.edu/~rgens/teaching/literature/sar_speckle_filtering.html.
[Source: Remote Sensing of Snow and Ice ]
table of contents
|
Sensor type
|
Instrument
|
Satellite
|
Years
|
Frequency & Polarization
|
Spatial Resolution (Inc. angle if appropiate)
|
Swath width (km)
|
Max. Latitude
|
Repeat Period (days)
|
|
Scatterometer
|
SeaWings
|
QuikSat
|
1999-
|
13.4 HH, VV
|
50km
|
600 x 2
|
89.5
|
|
|
Scatterometer
|
AMI-Scat
|
ERS-1, -2
|
1991-
|
5.3 VV
|
50km
|
500
|
87.8N, 75.1S
|
|
|
SAR
|
|
ERS-1, -2
|
1991-
|
5.3 VV
|
30m (23 degrees)
|
100
|
84.6N, 78.3S
|
3, 35, 178
|
|
SAR
|
|
Radarsat
|
1995-
|
5.3 HH
|
Minimal 10m x 9m (37-48°), maximal 100m x 100m (20-49°)
|
From 45km (for minimal resolution) up to 510km (for maximal
resolution)
|
88.4N, 79.1S
|
24
|
[Source: Remote Sensing of Snow and Ice]
table of contents
OKEAN RAR, ERS SAR and RADARSAT SAR:
Both
RAR and SAR images are usable for sea ice detection, but
high-resolution ScanSAR images are “particularly
suited”
Source: Comparison of sea ice
signatures in OKEAN and RADARSAT radar images for the northeastern
Barents Sea by V.Y. Alexandrov, S. Sandven, K. Kloster, L.P.
Bobylev, and L.V. Zaitsev. In: Canadian Journal of Remote Sensing,
Volume
30, Number 6, December 2004 , pages 882-892.
Free full
issue (46 MB) and an abstract
are available.
Scatterometer
Some sea ice edge detection
algorithms for the QuikScat
underestimated the ice edges. This (link) paper proposes and
evaluates a new sea ice edge detection algorithm for the QuikScat,
validates it with RADARSAT-1 images (amongst others) and comes to
the conclusion that a reliable ice edge detection seems to be
impossible by better resolutions than 2.225km.
“Automatic
detection and validity of the sea-ice edge: an application of
enhanced-resolution QuikScat/SeaWinds data” by
Haarpaintner, Tonboe Long and Van Woert
National Ice Center,
Washington, DC, USA; July 2004. In: IEEE Transactions on Geoscience
and Remote Sensing; Volume 42, Issue 7, pages 1433- 1443
table of contents
Sea Ice Remote Sensing Group,
Goddard Space Flight Center, NASA
Overview of their projects,
including AMSR-E sea ice animations and the current data set of
Satellite Microwave Radiometers (SMMR and DMSP
SSM/I)
http://polynya.gsfc.nasa.gov/seaice_projects.html
table of contents
Remote sensing of snow and ice
by Rees, Gareth
Boca Raton, Fl.; London : Taylor & Francis, 2006.
Remote sensing and image interpretation (5th edition)
byThomas M. Lillesand, Ralph W. Kiefer and Jonathan W. Chipman
New York: John Wiley & Sons, 2004
Remote sensing digital image analysis: an introduction (4th edition)
by John A. Richards and Xiuping Jia
Berlin; [London]: Springer, 2006.
All cited websites were accessed between 20.1.2008 and 27.1.2008.
table of contents
Author: Kathrin Roesner
Matriculation number 0788032