Brief explanation of use of F- ratio
to test significance of model fit.
Start with regression:
linear model of y~x : y=a+bx
For any
specific data point ![]()
The difference of any
data point from the overall mean ![]() can be divided in two parts:
can be divided in two parts:
![]()
And
taking the sum of squares over all the data, it can be shown that:
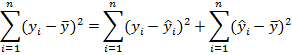
In other
words the total sum of squares (SST) equals the residual sum of squares (SSR)
plus the sum of squares of the model (SSM):[1]
![]()
The correlation
coefficient is ![]() ,
that is, the fraction of the total variance explained by the model. But this
does not directly take into account the number of data points
n used to estimate the parameters.
,
that is, the fraction of the total variance explained by the model. But this
does not directly take into account the number of data points
n used to estimate the parameters.
In the previous session
we used the F statistic to test the hypothesis of equal variance. In general,
the F statistic is a ratio of two scaled sums of squares, which follows a
scaled Chi-square distribution (exactly if the data are independent and
normally distributed). To test the correlation we use:
![]()
Under H0: no
correlation, y=a, our best prediction for ![]() so
SSM goes to zero.
so
SSM goes to zero.
Generalise to any pair of models
If we are trying to fit
model 1 and model 2 to n
data points, where model 2 has more parameters ![]() ,
and model 1 is ‘nested’ in model 2 (i.e. any fit to data by model 1 can
be obtained for some parameter setting of model 2, and model 2 can always fit
the data more closely than model 1) then we can compare them using the
F-statistic:
,
and model 1 is ‘nested’ in model 2 (i.e. any fit to data by model 1 can
be obtained for some parameter setting of model 2, and model 2 can always fit
the data more closely than model 1) then we can compare them using the
F-statistic:
![]()
Think of how
this applies to the H0 and H1 models for the simple regression above.
Apply to factorial data – ANOVA
(“analysis of variance”)
If x is
factorial, with k levels, then we can try to fit the model ![]() where
where ![]() if
the factor is at level k, 0 otherwise. This is hypothesis H1 with k parameters.
The null hypothesis H0 is y=a, i.e. that the level of the factor makes no
difference.
if
the factor is at level k, 0 otherwise. This is hypothesis H1 with k parameters.
The null hypothesis H0 is y=a, i.e. that the level of the factor makes no
difference.
For H0 our best
estimate of any observation is simply the mean of all the observations, ![]() .
For H1 our best prediction is the mean of the observations for that level of
the factor,
.
For H1 our best prediction is the mean of the observations for that level of
the factor, ![]() .
.
As before we have
SST=SSR+SSM, this time calculated as:
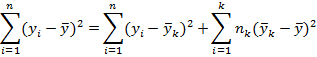
Where ![]() is
the number of data points at level k, and total data points is
is
the number of data points at level k, and total data points is ![]()
Our test
statistic is:
![]()