Markov chain Visualisation tool User Manual
The tool enables a user to specify a Markov chain by creating and dragging states onto a canvas, then click and drag links between the nodes, the links can then be given values that in a continuous Markov chain would represent rates in the system, and in a discrete Markov chain would represent probabilities.
Once the chain has been created, and a start state specified, the system then verifies it if it is a Discrete Markov chain. If it is a continuous Markov chain, it is discretized (converted into a discrete Markov chain) and this discrete Markov chain is then verified. If it is not correct, it returns to the design screen highlighting the unbalanced node(s).
If verified, the chain is displayed and from the stating state, the probability distribution on each node is represented in the form of colours. There are then several different methods to analyse the chain. One such option is to animate the probability distribution for a specified number of steps at a time, but halting if the system reaches a steady state (where the probability distribution no longer varies with time as the system settles into a regular pattern of behaviour). In addition, as an extension to the project, analysis tools have be added to provide more information about a specified chain.
This is a short user manual with a quick overview of all the operations in the applet
1.1.1 Discrete
1.1.2 Continuous
1.4 Moving objects
1.6 Labels
1.7 Verify
1.7.1 Unbalanced states
1.7.2 Absorbing states
2.2 Probability Distribution animation
2.2.1 Animation settings
2.2.2 Animate
2.2.3 Step
2.2.4 Reset
2.2.5 Steady state
2.3 First Passage time calculation
2.3.1 Changing FP state
2.3.2 Calculating
2.3.3 Animating
2.3.4 Reset
1. How to design the chain
This section is concerned with using the tool to specify a chain. It covers the operations used to create/alter a chain, how to verify, what the verification errors mean and how to progress to analysing the chain.
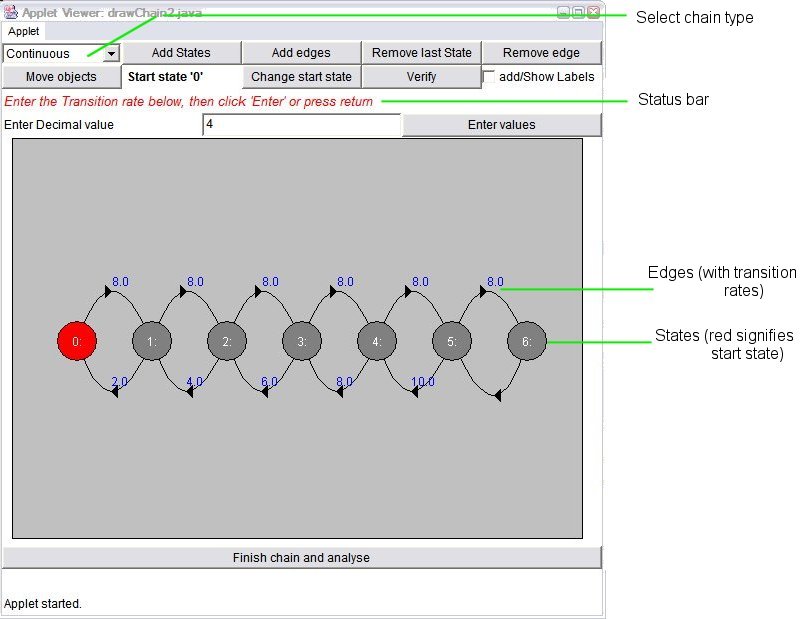
1.1 Select chain type
The first selection to make, is the type of chain you would like to create and analyse. To do this click the drop down box at the top left and select either Discrete or Continuous:
1.1.1 Discrete
Transitions between states represented as probabilities, chain represented as a transitional probability matrix on the system.
1.1.2 Continuous
Transitions between states represented as rates, chain represented as an infinitesimal generator matrix, but discretized to a transitional probability matrix for animation.
Once the chain type is selected all other options will become operational, allowing you to create a chain.
1.2 Adding states and edges
Adding states
To add states, click the “Add States” button and click the position you would like the state to be added. The state will appear and if labels are enabled (see label below) you will be asked to enter a label. You may then continue adding states to the canvas by clicking on a location on the canvas, or select a different option.
Adding edges
To add edges, click the “Add edges” button and click on the state from which you would like to start, then click on the state at the end of the edge. Now you will be asked to specify a centre point for the edge, simply move the mouse until you are happy with its position and click. You will now be asked to enter a value for that edge if a Continuous chain (or a numerator and denominator for a Discrete chain). Enter the value and click the enter values button and the edge will be added to the canvas. You may then continue adding edges to the canvas by clicking on a start state for the next edge, or select a different option.
1.3 Removing states and edges
Removing the last state
Click the “Remove last State” button to remove the last added state (the state with the highest ID)
Removing edges
Click the “Remove edge“ button, then click the start state of the edge to be removed, then click the end state to remove the edge.
1.4 Moving objects
Moving states
Click the “Move objects” button, then click and hold the mouse button on the state you wish to move, drag the mouse to the new desired location and release the mouse button to fix the new location of the state.
Moving edges
Click the “Move objects” button, then click and hold the mouse button on the arrow point of the edge you would like to move, drag the mouse to the new desired location and release the mouse button to fix the new location of the Edge.
1.5 Setting the start state
The start state is the point at which the probability distribution animation and first passage time will start. The start state is initially set to the first state in the chain (state 0).
Changing the start state
Click the “Change start state” button and click on the new start state, the status bar will change to reflect your choice.
1.6 Labels
The tick box toggles labels on and off, with labels on you will be prompted for a label as you create a state (labels must be 8 chars or less and lowercase) and these will be displayed under the states.
1.7 Verify
Click “verify” to verify that a Markov chain is balanced (all outgoing edges sum to 1) and warn about any absorbing states.
1.7.1 Unbalanced states
For a discrete Markov chain, all outgoing edges from a state must sum to 1 (or 0 for an absorbing state). If this is not the case, the status bar will indicate the states which are unbalanced, these states must be balanced before analysis can commence.
1.7.2 Absorbing states
An absorbing state is a state that has no outgoing edges. You may still analyse a chain with an absorbing state, in this system an absorbing state is modelled in the discrete matrix as having an edge going to itself with probability 1.
1.8 Analysing the chain
Click “finish chain and analyse” to verify the chain (see above) and proceed to analysing the chain (below).
2 How to analyse the chain
At present there are 2 methods to use to analyse the chain, Probability Distribution animation and First Passage time calculation.
At all points the states are coloured blue, the deeper the shade of blue, the higher the probability distribution.
2.1 To choose analysis tool
Click the drop down box at the top right of the screen and choose the tool you would like to use.
2.2 Probability Distribution animation
This tool is used to visualise the probability distribution as it evolves over time, the probability distribution is the probability that after n steps, the chain will be on each state, the sum of all the probability distributions for the chain will always sum to
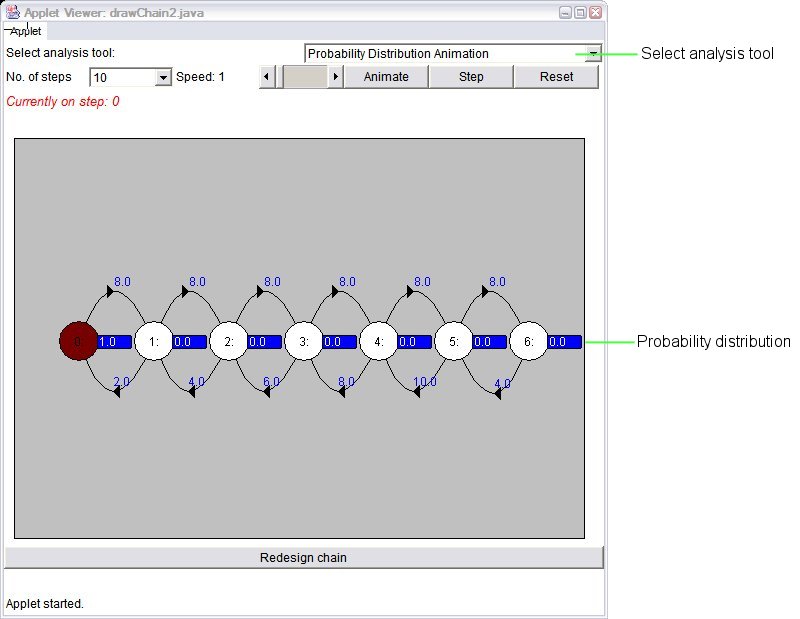
2.2.1 Animation settings
Clicking the animation button will animate the probability distribution from the current step until the No. of steps specified, refreshing the screen in the no. of steps specified. The settings are as follows:
No. of steps: specifies the step to stop animation
Speed: specifies the no. of steps to increment by and refresh the screen, e.g. if the speed is 2, the chain will animate the distribution in increments of 2.
2.2.2 Animate
Clicking the “Animate button” will begin animating the chain with the settings specified above. The animation will stop when the animation reaches the specified no. of steps, or the chain reaches steady state.
2.2.3 Step
Clicking the “Step” button will advance the probability distribution by the number of steps specified in speed above, if the chain reaches steady state before that time, the simulator will stop and report the step that it reached steady state.
2.2.4 Reset
Clicking the “Reset” button will reset the animation to step 0.
2.2.5 Steady state
Steady state is where the probability distribution no longer varies with time, as the system settles into a regular pattern of behaviour. Because the probability distribution is only graphically displayed to 3 decimal places, the probability distribution may be changing even though the colours and values on the screen are not.
2.3 First Passage time calculation
This tool is used to find the First Passage time of a certain state (the no. of steps before there is a positive probability that the chain will be in a specified state). First specify a First Passage state, then either choose to calculate the probability or animate to show how the state is reached.
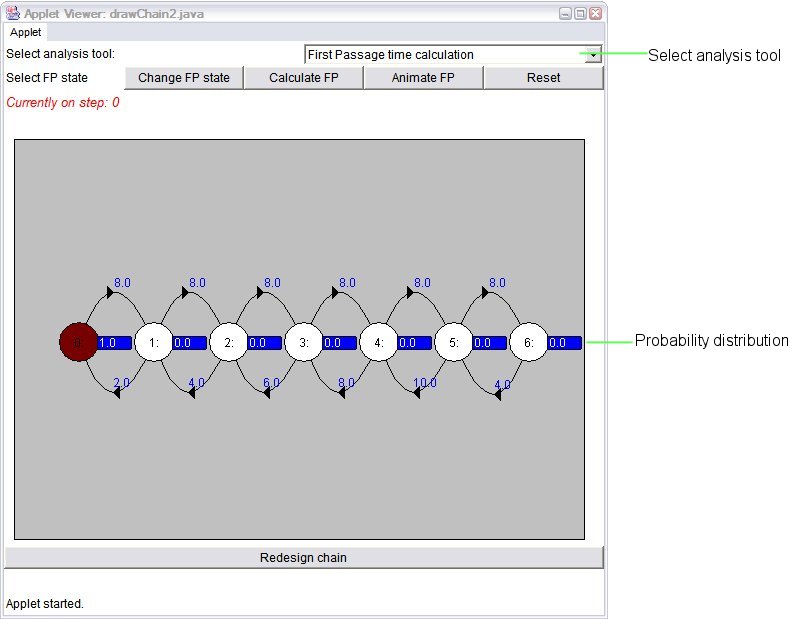
2.3.1 Changing FP state
Click the “Change FP state” button then click on state to choose the state whose first passage time and probability you wish to calculate.
2.3.2 Calculating
Clicking the “Calculate FP” button allows the system to calculate the probability and time for the first passage state specified. The results will be displayed in the status bar
2.3.3 Animating
Click the “Animate FP” button, the system will advance and animate the Markov chain 1 step at a time until the specified state is reached, then display the resulting first passage time and probability on the status bar.
2.3.4 Reset
See above