The Bezier curve was a concept developed by Pierre Bezier in the 1970's while working for Renault. The Bezier curve is a parametric curve which is defined by a minimum of three points consisting of an origin, endpoint and at least one control point. Unlike straight lines and circles where one of the variables can be set to discover a point on the line, with Bezier curves you sample as many times as required from t in [0,1] to obtain that many points. Each of these points returned is a function of the control points on the origin and endpoint.
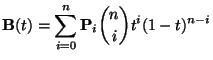
The equation for the Bezier curve is as follows where t is sampled from [0,1] as previously stated, and i is the ith of the n points. P0 represents the origin, Pn the endpoint and 1 through to n-1 are the control points.
An example of which can be seen here (image source, wikipedia). Points A & D are the origin and endpoint respectively and B & C the control points.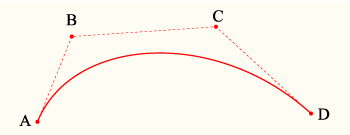 The benefit of Bezier curves is the ease of computation, stability at
the lower degrees of control points (warning! they do become unstable
at higher degrees) and a Bezier curve can be rotated and translated by
performing the operations on the points. See Paul Bourke's site for more properties of Bezier curves.
The benefit of Bezier curves is the ease of computation, stability at
the lower degrees of control points (warning! they do become unstable
at higher degrees) and a Bezier curve can be rotated and translated by
performing the operations on the points. See Paul Bourke's site for more properties of Bezier curves.
Little work has been performed in the use of Bezier curves as model features for feature detection. Vectorizing a monochrome image into a series of lines given a specified tolerance is efficient and fast. Mapping pixels or even a series of linked lines to a Bezier model feature dramatically increases the search space to work over making it a less attractive option.