------------------------------

Subject: Image Basics
Image Basics Contributed by Wim Bakker (bakker@itc.nl)
Image samples are usually called pixel or pel after the combination of "picture" and "element". A pixel is the smallest unit of a digital image. The size of this unit determines the resolution of an image. The term resolution is used for the detail that can be represented by a digital image. As discussed before the resolution is limited in four ways:
------------------------------

Subject: Resolution
------------------------------

Subject: Image Formats
The image data can be arranged inside the files in many ways. Most common ones are
If the pixels of the bands A, B, C and D are denoted a, b, c and d respectively then BIP is organized like
abcdabcdabcdabcdabcdabcdabcdabcdabcd...  line 1
abcdabcdabcdabcdabcdabcdabcdabcdabcd...  line 2
abcdabcdabcdabcdabcdabcdabcdabcdabcd...  line 3
...
abcdabcdabcdabcdabcdabcdabcdabcdabcd...
abcdabcdabcdabcdabcdabcdabcdabcdabcd...
BIP can be read with the following pseudo-code program
FOR EACH line
    FOR EACH pixel
        FOR EACH band
            I[pixel, line, band] = get_pixel(input);
BIL looks like
aaaaaaaaaaaa...  band 1, line 1
bbbbbbbbbbbb...  band 2
cccccccccccc...  band 3
dddddddddddd...  band 4
aaaaaaaaaaaa...  band 1, line 2
...
BIL can be read with the following pseudo-code program
FOR EACH line
    FOR EACH band
        FOR EACH pixel
            I[pixel, line, band] = get_pixel(input);
BSQ shows
aaaaaaaaaaaa...  line 1, band 1
aaaaaaaaaaaa...  line 2
aaaaaaaaaaaa...  line 3
...
bbbbbbbbbbbb...  line 1, band 2
bbbbbbbbbbbb...  line 2
bbbbbbbbbbbb...  line 3
...
cccccccccccc...  line 1, band 3
cccccccccccc...  line 2
cccccccccccc...  line 3
...
dddddddddddd...  line 1, band 4
dddddddddddd...  line 2
dddddddddddd...  line 3
...
BSQ can be read with the following pseudo-code program
FOR EACH band
    FOR EACH line
        FOR EACH pixel
            I[pixel, line, band] = get_pixel(input);
Of course others are possible, like the old EROS BIP2 format (for four
band MSS images) where the image is first divided into four strips.
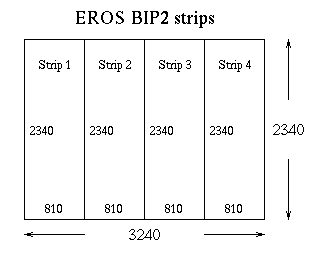
aabbccddaabbccddaabbccddaabbccdd... line 1
aabbccddaabbccddaabbccddaabbccdd... line 2
...
To decode one strip the following pseudo-code can be used
/* The '%' character is the modulo operator */
/* Note that operations on 'i' are integer operations! */
/* Copyright 1994 by W.H. Bakker - ITC */
FOR EACH line
    FOR i=0 TO BANDS*WIDTH
        I[(i/8)*2+i%2, line, (i/2)%4] = get_pixel(input);
Subsequently, the strips must be glued back together.
------------------------------

Subject: Basic Processing Levels
------------------------------

Subject: Is there a non-proprietary format for geographical/RS images?
GeoTIFF format is a non-proprietary geographic TIFF format. The purpose of GeoTIFF is to provide information that lets raster imagery (scanned maps, satellite images, results of geographic analysis, etc) be read automatically into correct position and scale within many GIS softwares. GeoTIFF implements a tag structure which embeds the geographic information methodically and interoperably (and invisibly to most users) inside the TIFF file.
Unlike many other formats, GeoTIFF is non-proprietary, supported by open, public domain utilities. The specs are maintained by NASA-JPL on the WWW and there are free software utilities written by several authors, free for the downloading. Major imagery utilization software developers, (including ESRI, Intergraph, Mapinfo, Softdesk, ERDAS, PCI, and others) and commercial imagery data providers (NASA-JPL, SPOT, Space Imaging, USGS, and others) participated in open cooperation to design the format.
GeoTIFF is now read by many GIS platforms, including all the recent releases of major GIS platforms in common commercial use. The main advantage to the user of GeoTIFF is that the *same image file* can be read by different, unrelated GIS's. Thus the end-user does not have to translate for each application - no duplication of files, no entering of strings, coordinates, generation of proprietary control files, etc. Most GIS's implement a point-and-click interface which most clients really appreciate. Clients who may not know anything about a "projection" or "datum" can easily get their imagery loaded in their GIS in correct position and scale.
TIFF readers that do not know about the GeoTIFF tags simply ignore them, and treat the TIFF image as any other ungeographic TIFF. The tags are used only by softwares that know where to look for them.
The official homepage of GeoTIFF is at NASA-JPL:

          http://www-mipl.jpl.nasa.gov/cartlab/geotiff/geotiff.html

SPOT maintains a WWW pointer page to a variety of GeoTIFF resources:

          http://www.spot.com/anglaise/news/press/devconf/resource.htm

and a FAQ at:

          http://www.spot.com/anglaise/news/press/devconf/gtiffaq.htm
There is also an intermittently active GeoTIFF discussion forum
which you can subscribe to (see the FAQ above for subscription
info).
------------------------------

Subject: Do I need geocoded imagery?
        The problem that Frank has is that he is working in an area without
adequate maps:  therefore, he cannot geocode his Landsat using a DTM, because
the data available is neither detailed enough or accurate enough to use as an
input.

        He can georegister the imagery using using one or two accurately
located ground control points and the corner-point positions given in the
image header:  these are calculated from ephemeris data of, usually, unknown
accuracy (within +/- 1 km), but internal image geometry is good so an x,y
shift and a (usually) very small rotation can take care of everything to
better than the accuracy of his maps.  Positions used should be
topographically low, and at the same elevation.   GPS is the best solution, as
someone else pointed out, if Frank can get in the field.

        The next problem is the parallax error introduced by the high relief.
In his situation, the only answer* is to get SPOT stereopairs and make a DTM or
DEM from them.  Except in the case of very narrow gorges or slopes steeper
than 60 deg. there should be few problems with carefully chosen images (high
sun angles, etc).  ERDAS has an excellent module for doing this.  However, I
doubt that Frank has the budget.  I believe ERDAS`s Ortho module would then
allow Frank to make an Ortho image that would be a perfectly good map.

        *there may be some LFC or Russian stereo coverage in this area, which
would be a lot cheaper than SPOT but would require the use of analog stereo
comparators (probably).

        Even if there were good topographic contour maps for all of Frank's
area, the cost of digitising these and turning them into a usable DTM would
probably be prohibitive (though there are outfits in Russia who might be able
to quote a price affordable to a large western company).
------------------------------

Subject: Imaging Instruments
Of course, this simplistic view is not the whole story.
Digital images comprise two-dimensional arrays of pixels. Each pixel is a sensor's measurement of the albedo (brightness) of some point or small area of the Earth's surface (or atmosphere, in the case of clouds). Hence a two-dimensional array of sensors will yield a two-dimensional image. However, this design philosophy presents practical problems: a useful image size of 1000x1000 pixels requires an array of one million sensors, along with the corresponding circuitry and power supply, in an environment far from repair and maintenence!
Such devices (charge coupled deices) do exist, and are essentially similar to analogue film cameras. However, the more usual approach for Earth Observation is the use of tracking instruments:
As the sensor now requires a large number of samples per line, the sampling frequency necessary for unbroken coverage is proportionally increased, to the extent that it becomes a design constraint. A typical Earth Observation satellite moves at about 6.5 Km/sec, so a 100m footprint requires 65 lines per second, and higher resolution imagery proportionally more. This in turn implies a sampling rate of 65,000 per second for a 1000-pixel swath. This may be alleviated by scanning several lines simultaneously.
Either design of scanning instrument may have colour vision (ie be sensitive to more wavelength of light) by using multiple sensors in parallel, each responding to one of the wavelengths required.
------------------------------

Subject: What is a Sounding Instrument?
Satellite-borne remote sensing instruments may be used for more than imaging; it is possible to derive information about the constituents of the local atmosphere above a ground target, for example. One common area of study is to observe atmospheric emissions in the spectral neighborhood of the 183GHz water absorption line (millimeter-wave; in-between microwave and thermal IR). These channels can be monitored by an appropriate collection of narrow passband radiometers, and the data that are returned can be analyzed to deduce the amount of water vapor present at different levels (altitude layers) in the atmosphere. The reference to "sounding" is an application of an old nautical term, the investigation of the state of a medium at different depths (original application: the ocean - specifically determination of the depth of the ocean floor).
------------------------------

Subject: Orbits
Wim adds the question "When can *I* see a specific satellite", and suggests the following pointers from his list:
Jonathan's Space Report is at http://hea-www.harvard.edu/QEDT/jcm/jsr.html. The introduction:
The Space Report ("JSR") is issued about once a week. It describes all space launches, including both piloted missions and automated satellites. Back issues are available by FTP from sao-ftp.harvard.edu in directory pub/jcm/space/news. To receive the JSR each week by direct email, send a message to the editor, Jonathan McDowell, at jcm@urania.harvard.edu. Feel free to reproduce the JSR as long as you're not doing it for profit. If you are doing so regularly, please inform Jonathan by email. Comments, suggestions, and corrections are encouraged.
The SATCOV program is available by anonymous FTP from sun_01.itc.nl
(192.87.16.8). Here's how to get it:

$ ftp 192.87.16.8
Name: ftp
Password: your-email-address
ftp> bin
ftp> idle 7200
ftp> prompt
ftp> cd /pub/satcov
ftp> mget *
ftp> bye
$

If you can't use FTP, drop me a line and I will send a uuencoded version
by email.

Those of you who prefer a WWW interface can obtain it from the following URL:
        http://www.itc.nl/~bakker/satcov
Don't forget to set the "Load to local disk" option.

SATCOV is a PC program for converting Path/Row numbers of Landsat and
K/J of SPOT to Lat/Lon and vice versa. Furthermore it can predict the orbits
of the NOAA satellites, although I wouldn't recommend it for this purpose!
But that's an other can of worms....
------------------------------

Subject: Ground Stations
1. GROUND RECEIVING STATIONS
This document is an introduction to Ground Receiving Station (GRS) acquisition and processing of remote sensing satellites data such as SPOT, LANDSAT TM and ERS-1 SAR. Ground receiving stations regularly receive data from various satellites so as to provide data over a selected areas (a footprints approximately covers a radius of 2500 km at an antennae elevation angle of 5 degrees.) on medium such as computer tape, diskette or film, and/or at a specific scale on photographic paper. GRS are normally operated on a commercial basis of standard agreements between the satellite operators and the Governments of the countries in which they are situated. Subject to the operating agreements, local GRSs sell products adapted to end users needs, and provide remote sensing training, cartography, and thematic applications.
2. GROUND RECEIVING STATION ARCHITECTURE
A Ground Receiving Station consists of a Data Acquisition System (DAS), a Data Processing (DPS) and a Data Archive Center (DAC).
2.1. DATA ACQUISITION SYSTEM
DAS provides a complete capability to track and receive data from the remote sensing satellite using an X/S-band receiving and autotracking system on a 10 to 13meter antenna in cassegranian configuration. DAS normally store fully demodulated image data and auxiliary data on High Density Digital Tapes (HDDTs). However, in one small UNIX based system, data storage can be stored directly on disk and/or electronically transmitted to distant archives.
2.2. DATA PROCESSING SYSTEM
DPS keeps an inventory of each satellite pass, with quality assessment and catalog archival, and by reading the raw data from HDDTs, radiometrically and geometrically corrects the satellite image data.
2.3.DATA ARCHIVE CENTRE
The Data Archive closely related to DPS offers a catalog interrogation system and image processing capabilities through an Image Processing System (IPS).
3. GROUND RECEIVING STATION PRODUCTS
The GRS products can either be standard or value added products. Both are delivered on Computer Compatible Tapes (CCTs), CD ROM, cartridges, photographic films or photographic paper prints at scales of 1:250 000, 1:100 000, 1:50 000 and 1:25000.
i.      Standard products
        - SPOT-1 and 2/HRV : data of CNES levels 0, 1A, 1B, 2A
        - Landsat TM : data of LTWG levels 0, 5,
        - ERS-1 SAR : Fast Delivery and Complex products.

ii.     Value added products
        - For SPOT
                .       P + XS : Panchromatic plus multi-spectral,
                .       SAT : a scene shifted along the track,
                .       RE : a product made of 2 consecutively acquired scenes,
                .       Bi-HRV : Digital  mosaic produced by assembling 2 sets of
 2                              scenes acquired in the twin-HRV configuration.
                .       Stereoscopy : Digital terrain model (DTM) generation,
                .       Levels 2B, S and level 3B using DTMs.

        - For Landsat TM: levels 6, S and 7.
        - For ERS-1 SAR : geocoded data.

        - For any instrument:
                .       Image enhancement and thematic assistance,
                .       Geocoded products on an area of interest defined by the
			customer (projection, scale, geocoding and mosaicking
			according to the local map grid).
4. GROUND RECEIVING STATION OPERATIONPersons needing images for thematic applications in the field of cartography, geology, oceanography or intelligence, etc, will refer to the station catalog in order to find out if the data are available over the area concerned.
There are two possibilities :
b) For other sensors, LANDSAT TM or ERS-1, the satellite ephemerides are known at GRS and the antenna is pointed accordingly in order to track all selected passes.
DPS is also in charge of automatic processing of selected raw data in order to produce images of standard level.
Value added products with cartographic precision are produced within DPS using interpretation workstations which must be part of an operational Geographic Information System (GIS) combined to an Image Processing System (IPS).
Once processed, the data, on CCT, are sent to the Data Archive Center (DAC) where they are delivered to the customers after a quality checking. At DAC, further processing may be applied to the data such as image stretching, statistical analysis, DTM, or a conversion from tape to film and paper prints in the photographic laboratory; "customized services" may also be offered.
------------------------------

Subject: How can I assess my results?
Second, a summary of responses to my posting about contingency table statistics
and coefficients. Basically, I need to come up with a single statistic for
an error matrix, along the lines of PCC or Kappa, but which takes into
account the fact that some miscalssifications are better or worse than others.

Tom Kompare suggested readings on errors of omission or commission.
Chris Hermenson suggested Spearman's rank correlation.
Nick Kew suggested information-theoretic measures.

Others expressed interest in the results; I'll keep them posted in future.

The responses are summarized below.


===============================================================================
Michael:

Your thinking is halfway there. Check out how to use an error matrix to get
+ errors
of Omission and Commission.

        Good texts that explain it are:

        Introduction to Remote Sensing, James Campbell, 1987, Gulliford Press
        start reading on page 342

        Introductory Digital Image Processing, John Jensen, 1986, Prentice-Hall
        start reading on page 228 or so.

These are the books where I learned how to use them. Sorry if you don't have
+ access
to them, I don't know how Canadian libraries are.

                                Tom Kompare
                                GIS/RS Specialist
                                Illinois Natural History Survey
                                Champaign, Illinois, USA
                        email:  kompare@sundance.igis.uiuc.edu
                          WWW:  http://www.inhs.uiuc.edu:70/
============================================================================

Excerpt from my response to Tom Kompare (any comments welcome...)

These are useful readings describing error matrices and various measures we can
get from them, eg PCC, Kappa, omission/commission errors. But from these
+ readings
I do not see a single statistic I can use to summarize the
whole matrix, which takes into account the idea that some misclassifications
are worse than others (at least for me). For example, if I have two error
matrices with the same PCC, but with tendencies to confuse different categories,
I'd like to get a ststistic which selects the 'best' matrix (ie the best image).
One simple way I can think of to do this is to supply a matrix which gives
a 'score' for each classification or misclassification, and then multiply each
number in the error matrix by the corresponding number in the 'score' matrix.
So a very simple example of such a matrix might look like this:

                   Deciduous    Conifer    Water
         Decid         1.0        0.5        0.0
         Conifer       0.5        1.0        0.0
         Water         0.0        0.0        1.0

In this notation, the 'score' matrix for a PCC statistic would be a diagonal
matrix of "1". Obviously there are a number of issues for me to think about
in using such a matrix, eg can you 'normalize' the score matrix? Can you
use it to compare different matrices with different numbers of categories?
An obvious extension to this would be to apply this idea to the Kappa
statistic as well.

===========================================================================
Hi Michael;

Spearman's rank correlation is often used to test correlation in a situation
where you are scoring multiple test results.  You might be able to adapt
it to your problem.

Chris Hermansen                         Timberline Forest Inventory Consultants
Voice: 1 604 733 0731                   302 - 958 West 8th Avenue
FAX:   1 604 733 0634                   Vancouver B.C. CANADA
clh@tfic.bc.ca                          V5Z 1E5

C'est ma facon de parler.
=========================================================================

Hi,

Your question touches on precisely the field of research I'd like to be
pursuing, if only someone would fund it:)

> Hi,
> I'm comparing different datasets using contingency tables, and I would
> like to come up with summary statistics for each comparison. I am using
> the standard PCC and Kappa, but I'd also like to come up with a measure
> which somehow takes into account different 'degrees' of misclassification.
> For example, a deciduous stand misclassified as a mixed stand is not as
> bad as a deciduous stand misclassified as water.

I would strongly suggest you consider using information-theoretic measures.
The basic premise is to measure information (or entropy) in a confusion matrix.
I can send you a paper describing in some detail how I did this in the
not-totally-unrelated field of speech recognition.

This does not directly address the problem of 'degrees of misclassification' -
just how well it can be used to do so is one of the questions wanting further
research.   However, there are several good reasons to use it:

1) It does address the problem to the extent that it reflects the statistical
   distribution of misclassifications.   Hence in two classifications with
   the same percent correct, one in which all misclassifications are between
   deciduous and mixed stands will score better than one in which
   misclassifications are broadly distributed between all classes.
   Relative Information is probably the best general purpose measure here.

2) By extension of (1), it will support detailed analysis of hierarchical
   classification schemes.   This may be less relevant to you than it was
   to me, but consider two classifiers:

A: Your classifier - which for the sake of argument I'll assume has
   deciduous, coniferous and mixed woodland classes.
B: A coarser version of A, having just a single woodland class.

Now using %correct, you will get a higher score for B than for A - the
comparison is meaningless.   By contrast, using information (Absolute,
not Relative in this case), A will score higher than B.   You can
directly measure the information in the refinement from B to A.

> In effect I guess I'm
> thinking that each type of misclassification would get a different 'score',
> maybe ranging from 0 (really bad misclassification) to 1 (correct
> classification).

I've thought a little about this, as have many others.   The main problem is,
you're going to end up with a lot of arbitrary numerical coefficients, and no
objective way to determine whether they are 'sensible'.   Fuzzy measures can
be used, but these are not easy to work with, and have (AFAIK) produced
little in the way of results in statistical classification problems.

> I can invent my own 'statistic' to measure this, but if there are any such
> measures available I'd like to use them. Any ideas?

Take the above or leave it, but let me know what you end up doing!

Nick Kew
nick@mail.esrin.esa.it

============================================================================

--
Michael Joy                            mjoy@geog.ubc.ca
University of British Columbia, Vancouver, B.C., Canada
------------------------------

Subject: Is there a program to compute Assessment measures, including Kappa coefficients?
Old reference to Dipak Ram Paudyal's kappa program deleted, as the FTP server is apparently no longer available.
------------------------------

Subject: How good are classification results in practice?
Mike Joy posted a question regarding irregularities between two
classifications, one derived from manual interpretation of
large-scale aerial photography, the other from a supervised and
enhanced spectral classification of Landsat TM imagery.

I've read several of the responses, and I just thought it time
to kick in my $0.02 worth, since I am quite familiar with both
of the classifications with which Mike is working.

First, Peter Bolton rattles off his experience in tropical forests
and chastises Mike for discovering what should have been obvious.
Well, Peter, the boreal forest is a much different beast than
what you're used to in Malaysia (I can attest from firsthand
experience in both cases).  Classification from remotely sensed
data is generally quite reliable in the boreal forest, especially
given the vegetative nature of the TM-derived classification
that is Mike's second dataset.  Detecting predominantly deciduous
from predominantly coniferous stands is (spectrally speaking)
pretty straightforward.  Problems arise in mixedwood stands,
however, since the nature of the classification of proportion
is not necessarily the same and in any case any aggregative
techniques applied to the TM image prior to classification (eg
smoothing) could significantly alter the proportional balance.
Also, depending on the proportion of deciduous in a predominantly
coniferous stand, and the spatial distribution of deciduous trees
within that stand, the classifier may have difficulty detecting
the differences between mixedwood and younger pure coniferous
types.  Furthermore, deciduous stands with coniferous understory
are classified as deciduous in Mike's first dataset but may
easily be interpreted as mixedwood stands in the TM image.

Secondly, on the subject of incorporation of field data, Mike's
second dataset has some ground truthing incorporated in the
classification.

Thirdly, on the subject of large numbers of classes in some
people's TM-derived classifications, remember that in many cases
these additional classes are derived by incorporating other
datasets (field measurements, other digital map data, DEM
information, etc).  The people I've seen most test this envelope
are the folks at Pacific Meridan Resources; their TM-derived
datasets form only the first step of several.  As Vincent
Simonneaux points out, most people stop at the first step.

So, in response to Mike's original questions:

> 1) Is it reasonable to expect a TM-based classification to accurately
>    distinguish Coniferous and Deciduous forest? The area I am dealing
>    with is boreal mixedwood forest in northeren Alberta, Canada. I had
>    expected that the classification should at least be able to do this.

On the face of it, yes.  But!  You must ensure that your definition of
Coniferous and Deciduous forest is exactly the same in both cases (and
the prevailing definitions in use in Alberta don't exactly help out in
this case).

> 2) Do people out there have similar experiences, i.e. the actual
>classification
>    accuracy being very much lower than the reported results, or major
>    differences when comparing with different source of information?

Of course, this is a possibility; the most unreliable classes may
interfere in a nasty way between to datasets.  You really need to ensure
that you are sampling the same population in both cases; then you need
to examine the distribution of errors among classes in both cases.  In
your first dataset, you don't really have error estimates with which to
work.

>                                                                      I
>    understand that an air-photo-based forest inventory and a TM satellite
>image
>    are measuring different things, and that I shouldnt expect perfect
>agreement,
>    but I would have thought they could agree roughly on the overall area of
>    Coniferous or Deciduous forest. Ditto for two similar TM-based
> + classifications.

Once more, not necessarily.  See the points above on coniferous understory
in deciduous stands and the basic definitions of coniferous/deciduous
split.

There are, of course, really obvious errors that can occur, like using
pre-leaf or post-leaf images when trying to locate deciduous stands...

Sorry to go on at such length about this; I hope that my comments are of
interest to some of you.

------------------------------

Subject: I need to classify a mosaic of several images.   How best to do it?
David Schaub (dschaub@dconcepts.com) posted a question on this. Here is his summary of replies:
Dear Netters,

Some time ago I posed a  question to this list with regards to classification,
rectification, and mosaicking.   My original question was as follows--

>Hello,

>We need to georectify, mosaic, and classify several (3 or 4) Landsat TM
>scenes using ERDAS Imagine.  The classification will need to show major
>land cover categories, such as bare ground, grassland, shrubby range,
>built-up, coniferous forest, broad-leaf forest, water, etc.  In the past
>when we have done this the seams between images are quite evident in the
>classification.  We would like to minimize differences between images, yet
>be asaccurate as possible in the classification of each image.

>My main questions are these -- Should we classify each image separately
>and then mosaic them, or should we mosaic the images first and then
>classify them?  Can georectifying the images effect the classification?

>You can assume that images along a path will have the same acquisition date,
>however scenes on adjacent paths will have different dates (at least by two
>weeks).  I will post a summary.  Thanks in advance for your opinions :-)

This quickly generated a flood of responses.  While there wasn't complete
agreement, the majority of respondents believed that I should first classify
the images, then do the rectification and mosaicking.  Nearest neighbor
should be used when rectifying the classified image (or if the image data
are rectified before classification).  Thanks to all who responded!!  Comments
are summarized below:

David Schaub
dschaub@dconcepts.com

*******************************************************************

     I have done the same things you are attempting to do for my thesis work.
I think the best course of action would be to classify the images first, then
rectify the images and then merge or mosaic the images.  Rectifying the images
before you classify may distort the spectral characteristics of pixels and
thereby influence your classification.  Furthermore, the smaller the area you
are classifying, the more accurate the classification will be, so if you
mosaic a large area and then attempt to classify the mosaiced image, there
will be more confusion possible based on the heterogeneity of a larger area. I
hope this helps, contact me if i can be of further assistance.

David Smith

*************************************************************

Here's my 2c for what it's worth...

I classify TM scenes separately and then mosaic the classifications. My
classifications almost never have a seam in them...If there is a seam
it is usually due to the difference in the date of the scene. You have
to be careful though... you need to use the same method of classification
(plotting out feature spaces and elipses helps) for overlapping scenes.
Sometimes this is why people use the other method...

If you're going to do this the other way round...i.e. mosaic and then classify
scenes you will have to calibrate the scenes to radiance and then use some
kind of atmospheric correction before mosaicking them.  This should in theory
minimize the difference in the spectral information between scenes....I would
avoid using any kind of histogram equalization ...although it may look nice,
you are loosing the original pixel information.

\\.   _\\\_____
 \\\ /ccccccc x\        Fiona Renton, GIS and remote sensing analyst
  >>Xccccccc(   <       CALMIT, Conservation and Survey Division
 /// \ccccccc\_/        University of Nebraska-Lincoln
''     ~~~~             renton@fish.unl.edu

**********************************************************************

What sort of classification?   Pixels?   Clusters?   Polygons?
Higher-level features?    If your classification units are homogenous
and shape is not important, you should clearly do it before mosaicing.
If not, you have a genuinely interesting problem, and will probably have
to your own research (starting at your local academic library, assuming
there is one :-)

Nick.

*********************************************************************

Geo-rectification will have a small effect on classification due to the
resampling process.  I can't help to much on classification part,
because that is not my area, but my feeling is that mosaicking
non-classified images may be easier than trying to match features in a
classified image.

Ok, this is my area.  You can not assume that images on the same path
are imaged on the same day, However, they could be.  You should be able
to check the meta-data to find out if they were.  The next path west
could have been imaged 7 days after the path of interest or 9 days
before and the next path east could have been imaged 9 days after the
path of interest or 7 days before, again check the meta-data.  The next
chances are to add 16 days on to those numbers (i.e. 7 + 16).

This is true for Landsat 4 and 5 only (will be true for Landsat 7).

Chuck
wivell@edcsnw38.cr.usgs.gov

************************************************************

Yes the georectification process will affect the classification
results.  My suggestion is to classify each individual image first and
then mosaic them together.  I have done this before and it works well.
If you mosaic first and then classify you have to calibrate the data,
apply radiometric corrections etc...  Not worth the trouble in my
opinion, and you probably won't get any good results.

The resampling technique (convolution) will affect the radiometric value
of the image and may not be suitable for adequate identification
aftrewards.  To avoid visible seams, just go around the areas, try to
contour the natural groupings (classes after classification)


To resume, in my opinion, if you want good accurate results: Classify first
and after mosaic.

Francois Beaulieu

************************************************************

You definitely want to mosiac the 4 images first (into one file) and
then run the classification on that.  Because of subtle differences in
the radiometric characteristics of each image, the classes in separate
classifications will rarely "line up" perfectly when mosaicked afterward.

> Can georectifying the images effect the classification?

Yes it can, depending on the resampling technique you use.  When
rectifying the images, use Nearest Neighbor resampling as that
will ensure that original pixel values are used to create the
new rectified dataset.  (Bilinear or Cubic will average the
original data, resulting in slight degradation.)  I would:

1)      Rectify the four images (use Nearest Neighbor)

2)      Contrast balance them, using for example Histogram
        Matching or another technique.

3)      Mosaic the four contrast balanced scenes into one file.

4)      Run the classification.

I hope this helps.


Eric Augenstein
Manager of Training Services

*************************************************************

In general you can't depend on the DN values from one image to the next
to be related. You should classify before your mosaic - in other words
mosaic the classification, not the images. Otherwise you mix unrelated
DN values into a signal classification which would be wrong.

Classification may be affected by geo-rectification. If the
geo-rectified image has the same pixels and pixel values as the
original, the classification should not be affected. However, this is
an unreal assumption. A geo-rectified image will almost always have
resampling - which means that pixels are either dropped or replicated -
unless a filter is applied (like bilinear or cubic convolution) in
which case the pixel values change as well.

If the classifier is single pixel based (like isodata) then the
classification is only affected by the resampling as the sigatures are
affected by the replication or dropping of values. If the classifier is
regional or global (like multi-resolution/multi-scale classifiers, or
region linking) then the classifiers may be affected to a greater
degree.

You can classify before or after geo-rectifiction and the results
will not be vastly different.

But the bottom line to mosaic at the very end.

Michael Shapiro                   mshapiro@ncsa.uiuc.edu
NCSA                              (217) 244-6642
605 E Springfield Ave. RM 152CAB  fax: (217) 333-5973
Champaign, IL 61820

********************************************************

Re Michael Shapiro's posting,

There is no doubt that that you cannot depend on the DN values from one
image to the next (especially with images from adjacent paths which are
taken on different dates (see Chuck Wivell's posting).

However mosaicing images which have been classified seperately may produce
unusual results ie trying to match classes from different images.

A suggestion would be to first try some kind of atmospheric correction on
the images, mosaic them and then classify them together. Assuming

i) you can do a credible atmospheric condition (using Dark Pixel
Substraction, Band Regression etc) plus, perhaps, correct the images to a
constant solar elevation angle
ii) the images from different paths were not taken on widely different
dates and
iii) (linked to ii) the ground conditions are similar for the images
from different paths

then the DN values between images should be comparable.

Euan

************************************************************

We are currently doing a statewide land cover classification for Mississippi
using TM scenes (10 of them). My responses for your questions:

   1. We classified each scene separately - mainly because the dates differed
      and in the cases where we had adjoining scenes taken on the same day, it
      was decided that classifying a full scene was a big enough task in both
      computer and human resources. If you had subscenes, it would not be too
      bad. I would advise against mosaicking scenes before classifying - your
      signatures for the same landcover class in the other scene(s) would be
      different and it would be a nightmare. Matching techniques that changed
      image pixel values would change your original data and corrupt your
      classification.

   2. We also georeferenced each scene before classification for the following
      reasons:

        - georeferenced ancillary data sources (roads, streams, NWI, etc) were
          used - including leaf-off TM scenes already in-house.
        - the need to have maps to take into the field for pre and post
          classification checks.

      We used nearest neighbor. This doesn't change pixel values but just
      moves them to a different location. In our case the image statistics
      were unchanged after georectification although it is probable that some
      pixels may be dropped or replicated (but when you georeference the
      classified image, those same pixels are going to be affected anyway).

Bottom line would be to classify each scene separately.  I would georeference
each TM scene first - when the classiciations are completed, stitching is
easy.

Jim

************************************************************

Our lab has had luck using regression techniques to mosaic the three
bands together.  Using ERDAS imagine, the steps are:
    1)  create an image where the two scenes overlap (this is best
            done with modeller, not layerstack:  layerstack only
            uses the geographical boundaries, whereas you want to
            have the area where there are values in both images
    2)  Use the Accuracy Assessment module to create random points
            on the image and remove those points which lie in cloud
            or shadow.
    3)  Export the X,Y coordinates from the random points and use
            these as a point file in the Pixel-to-Table function.
            Use the overlap image as the output image (make sure
            you have all the bands you want to regress (ie. image
            one's band 3,4,5 on top of image 2's 3,4,5
    4)  You now have a set of points that can be imported into
            any standard statistical package.  You need to have the
            values from the "larger" or primary image be the Y values
            and the other image be the X value (I'm told the correct
            statistical term is that the Y is the master and the X
            is the slave).

This should create a seamless image.  Obviously, the closer the B
number in the Y= bx + constant equation is to 1, the less you are
transforming the values of your slave image. We have also tried doing
classifications of each image first, but the results have been
disappointing.

Regards,
Sean Murphy
University of Maine

********************************************************************