Fish Trajectory Ground Truth Dataset |
The study of marine life is important especially for understanding environmental effects such as pollution, climate change etc. However, accessing underwater data is mostly very difficult. Fish behaviour analysis is helpful to detect such environmental effects by extracting the change in behaviour patterns or finding rare behaviours and detecting the behavioural distinctness of different species.
The traditional way of analyzing fish behavior, which is by human visual inspection, makes this task time consuming and limits the number of processed videos. On the other hand, fish trajectory analysis has been studied for different purposes. However, those researches were performed in constrained places like an aquarium, a tank, or a cage which makes the analysis simpler and also removes the effect of habitat on the behavior of fish. In contrast, we are interested in fish trajectories in unconstrained underwater videos.
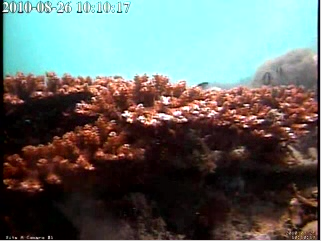
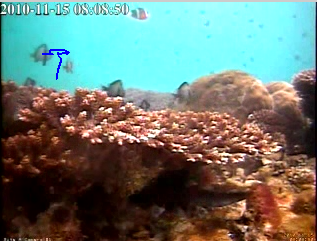
A sample view of the scene where the detected fish are found.
The dataset does not consist of the raw images. The dataset contains a summary of each detected fish in each frame with the description of:
More technically, the trajectory information is stored in the Matlab file fishDetections_total3102.mat. The file contains 3102 structures (fish_detections(i)), each of which corresponds to one fish trajectory. There are 3043 normal and 59 rare trajectories. Each structure contains these components, where N is the number of frames in the trajectory
        frame_number(1:N) :  frame number in original video
      bounding_box_x(1:N) :  bounding box leftmost edge
      bounding_box_y(1:N) :  bounding box topmost edge
      bounding_box_w(1:N) :  bounding box width
      bounding_box_h(1:N) :  bounding box height
               class(1:N) :  1=normal, 2=rare
    classDescription(1:N) : 'normal' or abnormal'
N can be found by N = size(fish_detections(i).frame_number)
One way of analysing fish trajectories is distinguish them as normal or rare trajectories. Detecting rare trajectories is useful when the system does not have any prior knowledge about the data which especially happens in the real-world data due to uncontrolled naturalness.
In this context, normal fish trajectories are defined as the trajectories which contain frequently observed behaviours of fish while rare trajectories can be defined as outliers, abnormal or unusual trajectories. In this dataset, the most usual and frequent behaviours of Dascyllus reticulatus are freely swimming fish in open sea and hovering on the coral which represents normal behaviours. On the other hand, abnormal trajectories are:
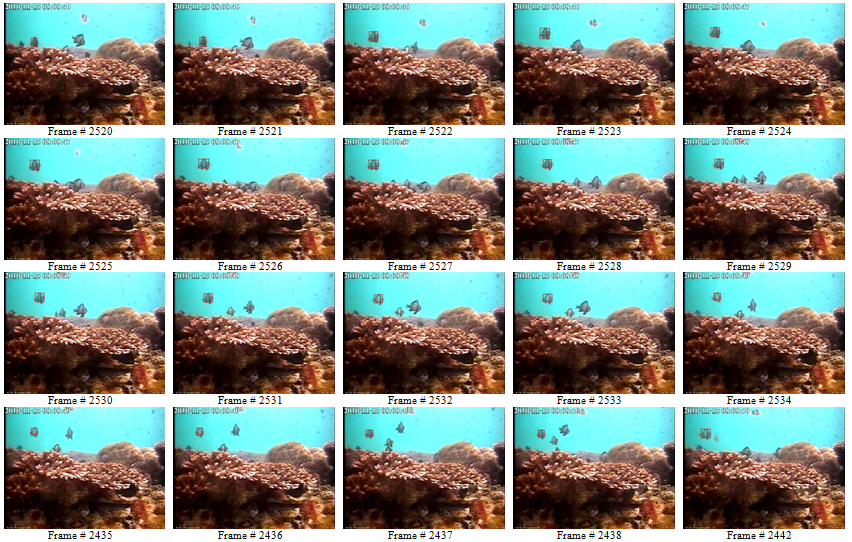
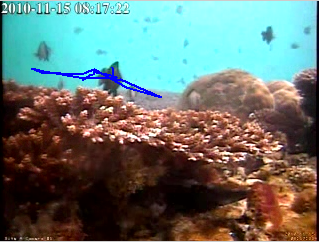
An example normal fish trajectory with detections (target fish has bounding box drawn):
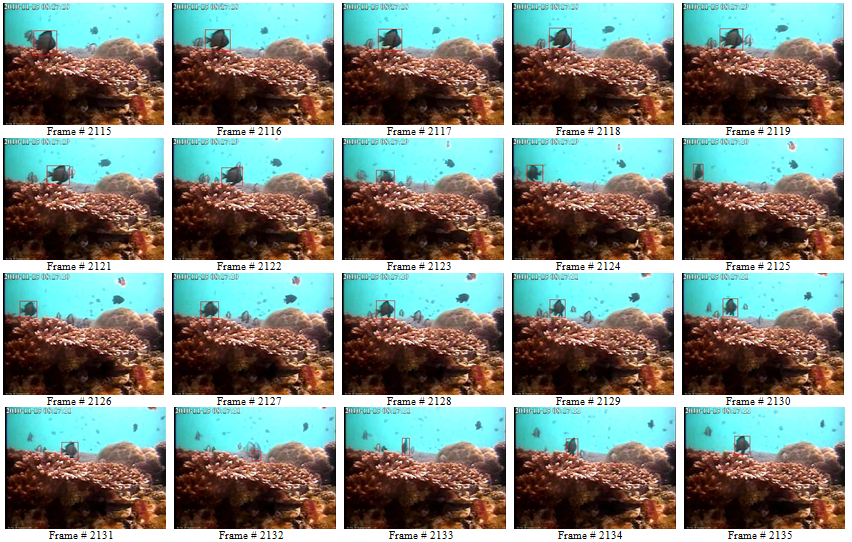
An example rare fish trajectory with detections
This data collection was funded by European Commission FP7 grant 257024 in the Fish4Knowledge project.
If you use the dataset in a publication please cite it as one of the following publications:
C. Beyan, R. B. Fisher, (2013), Detection of Abnormal Fish Trajectories Using a Clustering Based Hierarchical Classifier, British Machine Vision Conference (BMVC), Bristol, UK.
C. Beyan, R. B. Fisher, (2013), Detecting abnormal fish trajectories using clustered and labelled data, Proc. of International Conference on Image Processing (ICIP), Melbourne, Australia.
C.Beyan, R. B. Fisher, (2012), A Filtering Mechanism for Normal Fish Trajectories, Proc. of 21th International Conference on Pattern Recognition (ICPR), Tsukuba Science City, Japan.
There have been
accesses since October 2013.
© 2014 Robert Fisher
![]()