


As we have mentioned previously, one way of de-correlating probabilities
is to use a model. Take for example a set of data described by the
function  where a defines the set of free parameters
defining f and
where a defines the set of free parameters
defining f and  is the generating data set. If we now
define the variation of the observed measurements
is the generating data set. If we now
define the variation of the observed measurements  about the
generating function with some random error we can see that the
probability
about the
generating function with some random error we can see that the
probability 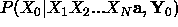 will be equivalent to
 as the model and generation point completely define
all but the random error.
as the model and generation point completely define
all but the random error.
Choosing Gaussian random errors with a standard deviation of  gives
gives
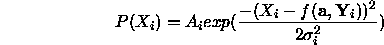
where  is a normalisation constant.
We can now construct the maximum likelihood function
is a normalisation constant.
We can now construct the maximum likelihood function
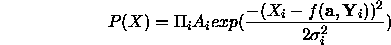
which leads to the  definition of log likelihood
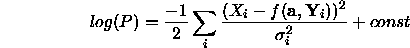
This expression can be maximized as a function of the parameters a
and this process is generally called a least squares fit.
Whenever you encounter least squares there is therefore a built
in assumption
of independence and Gaussian distribution. In practical situations
the validity of these assumptions should be checked by plotting the
distribution of  to make sure that it is Gaussian.
The choice of a least squares error metric gives many advantages in terms
of computational simplicity and later we will see that it is also
used extensively for definitions of error covariance and optimal
combination of data. However, the distribution of random variation
on the observed data X is something that generally we have
no initial control over and could well be arbitrary. This may initially
be seen as an overwhelming problem but
in most circumstances it is possible to make distributions
handleable (Gaussian) by transformation  and
and  ,
where g is chosen so that the initial distribution of
,
where g is chosen so that the initial distribution of  maps
to a Gaussian distribution in g .
maps
to a Gaussian distribution in g .
One good example of this is in the
location of a known object in 3D data derived from a stereo vision
system. In the coordinate system where the viewing direction
corresponds to the z axis, x and y measures have errors
determined by image plane measurement. However, the depth  for a given point is given by

where I is the interoccular separation, f is the focal length
and  and
and  are image plane measurements. Attempts to
perform a least squares fit directly in
are image plane measurements. Attempts to
perform a least squares fit directly in  space results
in instability due to the non-Gaussian nature of the
space results
in instability due to the non-Gaussian nature of the  distribution. However, transformation to
  yields Gaussian distributions and good results.
Under many circumstances, even after taking care to obtain Gaussian
variation on the fitted quantities, there is still one final problem
which needs to be addressed. This is the problem of fliers or outliers.
Fliers are the name given to the data generated by any real
system which do not conform to the assumed statistical distribution.
These
are generally caused by complete failure of the data measurement system
and generated well away from the expected mean of the distribution.
If ignored they can completely dominate the fitting process giving
meaningless results.
For example, measurement of the distance to an object pre-supposes
that we have selected the correct object. The correct way to deal with
these measures is to modify the expected probability
distribution to include the
long tails from fliers,
this leads to the branch of numerical methods known as
robust statistics. The simplest way to do this
which allows us to continue to use standard methods for covariance
estimation and optimal data combination, which assume
Gaussian distribution, is to limit the contribution to the  distribution from any data point to some maximum value
  .
This makes
the assumption that the statistical distribution is constant for any
gearing point greater than
.
This makes
the assumption that the statistical distribution is constant for any
gearing point greater than  from the expected position.
Unfortunately this process precludes the use of standard least squares
solution methods and solution must generally be iterative as the gearing
point will vary for each data point during parameter estimation. This
process is efficiently executed by the probabilistic Hough transform
for small numbers of parameters [7].
from the expected position.
Unfortunately this process precludes the use of standard least squares
solution methods and solution must generally be iterative as the gearing
point will vary for each data point during parameter estimation. This
process is efficiently executed by the probabilistic Hough transform
for small numbers of parameters [7].