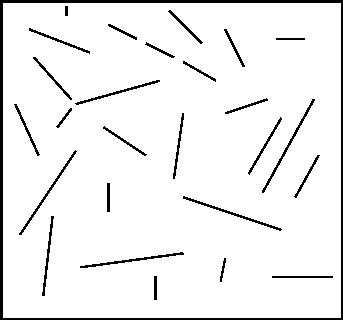
Figure 2: Groups formed by non-accidental properties


Previous to recognition and pose determination, the segmented data is examined to pick out those groups of points (or vectors) which can be used. One justification for the use of perceptual grouping in interpreting images can be found in human vision. People appear to make use of such groupings, and it can be shown that if clues which lead to such grouping are removed the interpretation of line drawings becomes more difficult.
In a Figure such as Figure 2, above, which shows a few deliberate perceptual groups added to a random line pattern, attention is drawn towards the groupings which are not accidental. The three groups introduced deliberately in the example are a group where lines are nearly joining -- the end points of the lines are in close proximity, a group where three lines are nearly collinear and a group where the three lines are nearly parallel. There is a long history of work in this area going back to the gestalt psychologists at the beginning of the 20th century. Lowe (Reference no2) and others have felt that these groups should be used to index 3D objects from 2D images.
Grouping also brings advantages by eliminating those elements which cannot be used, this leaves a smaller amount of data. The clues that remain are strengthened by drawing together the apparent non-accidental properties to replace the individually segmented elements by their grouped form. In this form it is possible to insist that they do satisfy the grouping which they appear to satisfy -- so those elements which almost join together are made to join, similarly those elements which nearly lie on a straight line are forced to lie on a straight line. These facts can then be used in the matching process.
Possible groups in a 2D image which may be given 3D meaning are shown in Figure 3.
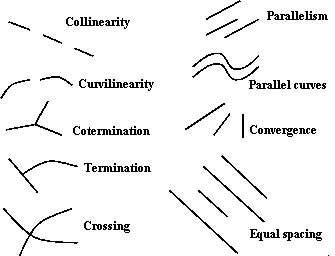
These can then used to decide what object is in image. This complete list includes collinearity and the equivalent for curves which are collinear (curvilinearity), coterminations, and parallelism both of straight and curved lines. Each of the observed 2D relations is unlikely to occur by accident; hence if we see coterminating lines in a 2D image we usually assume they are connected in 3D space. Other depicted relations are more complex; converging lines often imply parallel lines in 3D space (under perspective) or may be genuine converging lines. In the T-junction, we normally infer that the upper bar of the `T' is nearer to the camera and occludes the other curve. Similarly we infer in the crossing that both edges cannot be occluding and geometric. Relations such as equal spacings and regular spacing are rather higher level, we might infer the lines are both parallel and coplanar in the case illustrated, rather than just parallel.
The complete list is reduced usually to a much smaller list for practical purposes. This includes collinearity, parallelism and the cotermination of the end points of lines. When referring to lines it is possible that those lines may be straight or curved. Application is often limited to straight lines for several reasons -- straight lines in objects tend to be better segmented, the above relations tend to occur more frequently, and implementation is easier.
Lowe devised algorithms to automatically detect these groupings using a principle of scale independence. This was applied to build measures of the likelihood of the accidental appearance of a particular relationship between lines. This did not vary with the scale of the image. For example, the possible gaps between coterminating lines are made larger in proportion to the length of the lines themselves, so that a constant measure of probability of accidental occurrence should result. This measure can then be used to rank the lines in deciding which are the most significant of those relations.
Consider the particular case of joining the end points of two lines. Figure 4 shows two lines which nearly meet and the gap between them.
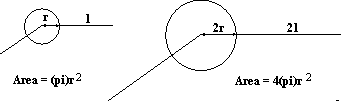
To measure the significance of that gap it is first considered if those two lines were placed completely at random how likely it
is that they would appear that close together. If one line is fixed and the other placed at random -- one end point of the second line must lie within the circle shown for there to be a random occurrence of a relation as good or better. Given no other information, a uniform distribution of end points is assumed with a density of end points per unit area of d. The area of the circle between the end points is  so there would be expected to be
  end points within that circle.
If  then it is unlikely that an observed cotermination occurred by accident.
The key is the separation of end points -- the significance of the relations varies directly with the square of the distance between the end points. The factor d is dependent upon the length of the line segments. If the situation is scaled by doubling the lengths of lines and the gap between them, the principle of scale independence tells us the answer should be unchanged. Doing this has increased the area by a factor of 4 and the lengths by a factor of 2. The effect of increasing the line length upon the density of end points has been to reduce it -- in order to contain the same number of end points in a circle the radius of the circle must now be twice as long and hence the area 4 times as large. In other words the density varies inversely with the square of the line lengths so that d can be replaced with  where D is a constant representing the scale independent distribution of end points. Substituting this into the formula for calculating the expected number of end points, and hence the significance of the proximity of the end points, gives
  ; i.e. N, the number of end points, is the number of ends on each line (2) times the scale independent density of end points divided by
  , to allow for the effect of the line length on that density, times the area. This overall significance measure can be used to decide which are the most important proximities of lines which we have in the image.
If 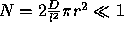 then it is unlikely that an observed cotermination occurred by accident (assuming constant D chosen suitably) .
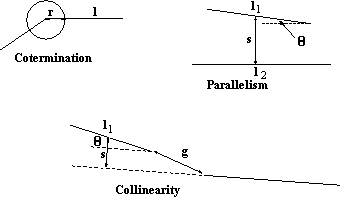
The cases for parallel and collinear lines yield similar expressions, shown in Figure 5.
If  then it is unlikely that an observed pair of parallel lines occurred by accident (assuming constant D chosen suitably) .
If  then it is unlikely that an observed pair of collinear lines occurred by accident (assuming constant D chosen suitably) .
(These expressions were modified subsequently by McAndrew [Reference no. 3] to give more intuitive results, although the same basic principles were applied.)
When applying these groups to real problems the main concern has been to identify the key perceptual cues to object identity; this led to the dominant use of the proximity algorithm. The other algorithms have been applied when determining overall statistics about an image. These show what sort of relationships are occurring in general and give some sort of measure of the most likely model from the database.


[ Introduction |
Solving for perspective inversion ]
Comments to: Sarah Price at ICBL.