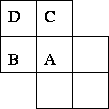
Given a binary image we wish to scan through it, identify distinct `blobs' and label each one uniquely. Connectivity will be described using a left-skewed 6-connectedness neighbourhood scheme, as shown in figure 1.
We scan the image using a typical raster scan, row by row, top to bottom, left to right. Then, when we examine a particular cell A, we know that the cell to its left, B, has already been labelled, as has the cell C directly above A. Moreover, the cell D directly above B is also considered connected to A so its labelling must also be taken into account.
The sequential scan labelling algorithm is described as follows:
if A = O          do nothing

else if D labeled
     copy label to A

else if (not B labeled) and (not C labeled)
     increment label numbering and label A

else if B xor C labeled
     copy label to A

else if B and C labeled
     if B label = C label
          copy label to A
     else
          copy either B label or C label to A
          record equivalence of labels
After running this algorithm to label all the pixels, a second scan
through the image is required to clean up the label equivalences,
giving each connected component in the image a unique label.
 |