No imaging system is perfect. Noise is introduced into the imaging process via the use of real lenses and cameras that differ in operation from the pinhole camera model. Moreover, lighting and atmospheric conditions can also effect the resulting image. In addition, digital images suffer deviations in image values introduced by sampling. Thus, measurements are affected by fluctuations in the signal being measured, and these fluctuations are described according to some probability distribution, p(x).
Since p(x) is a probability distribution, it always satisfies
![]()
and
![]()
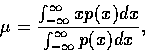
The mean or first moment of the distribution ![]() is given by
is given by
![]()
![]()
The spread of the distribution is given by the second moment or variance:
![]()
The cumulative probability distribution
![]()
tells us the probability that the measurement will be less than or equal to x. Thus, the probability density distribution is just the derivative of the cumulative probability distribution, that is, p(x) = P'(x).
One way to improve accuracy is to average several measurements, assuming that the `noise' in them will be independent and tend to cancel out. To see how this is indeed the case, we consider the following analysis.
Let x = x1+x2, the sum of two independent variables with probability distributions p1(x1) and p2(x2). Then what can we say about p(x), the probability distribution of x?
We first look at the probability of getting a value between x and ![]() . If the sum x1 + x2 is between x and
. If the sum x1 + x2 is between x and ![]() ,and we are given a value of x2, then x1 must be between
x-x2 and
,and we are given a value of x2, then x1 must be between
x-x2 and ![]() . The probability of this occurring
is
. The probability of this occurring
is ![]() .
.
But x2 can also take on a range of values. The probability that
x2 lies between a particular x2 and ![]() is
is
![]()
To get the probability that the sum lies between x and ![]() we have to integrate the product over all x2. Thus
we have to integrate the product over all x2. Thus
![]()
![]()
where t is a dummy variable of integration.
By a similar argument we can show symmetrically that
![]()
This is called the convolution of p1 and p2 and is denoted
by ![]() .
.
We can use this result to prove that the mean of the sum of several random variables is equal to the sum of the means, and the variance of the sum is the sum of the variances.
If we calculate the average of N independent measurements each having
mean ![]() and standard deviation
and standard deviation ![]() , then
, then
![]()
So the average ![]() will have mean
will have mean ![]()
![]() and standard deviation
and standard deviation ![]() .
.
This latter result is because the variance of the sum of the
distributions is just ![]() , and so the standard deviation of
the sum is
, and so the standard deviation of
the sum is ![]() . Thus the distribution
. Thus the distribution ![]() has
standard deviation
has
standard deviation ![]() and hence we obtain a
more accurate measurement by taking the average of N independent
measurements.
and hence we obtain a
more accurate measurement by taking the average of N independent
measurements.
The usual probability distribution we use to model noise in an image
is the normal or Gaussian distribution with mean ![]() and standard
deviation
and standard
deviation ![]() given by
given by
![]()
Of course, digital images are sampled versions of continuous or analog images, and the sampling is done both spatially and in the luminance values (where it is known as quantization).