Documentation
We illustrate the use of the Bio-PEPA Workbench on a simple SIR model of disease spread.
Bio-PEPA input files
The Bio-PEPA Workbench input file format is shown in the example below. This is a simple model of disease spread: a population is initially susceptible (S), then infected (I), then recovered (R). The rate at which infection happens depends on a constant (k1), and the number of susceptible and infected people. The rate at which recovery happens depends on another constant (k2), and the number of infected people. The Bio-PEPA input sir.biopepa is shown below.
             infect = [k1 * S * I];

             recover = [k2 * I];


             S = infect<< ;

             I = infect>> + recover<< ;

             R = recover>> ;


             (S <infect> I <recover> R)
Bio-PEPA parameter files
A parameter file sir.csv in comma separated value format contains the initial numbers of those susceptible, infected and recovered in the population, and the values of the constants k1 and k2. This file varies the rate (k2) at which the infected recover from the disease.
S,I,R,k1,k2

990,10,0,0.001,0.1

990,10,0,0.001,0.2

990,10,0,0.001,0.3

990,10,0,0.001,0.4

990,10,0,0.001,0.5

990,10,0,0.001,0.6

990,10,0,0.001,0.7

990,10,0,0.001,0.8

990,10,0,0.001,0.9

990,10,0,0.001,1.0
Bio-PEPA configuration files
A configuration file biopepa.cfg allows the user to specify controls such as the stop time of the simulation and the number of independent replications which are to be performed.
biopepa.simulator: stochkit

biopepa.simulation.stoptime: 100

biopepa.independent.replications: 10

biopepa.report.simulations.every: 1

biopepa.show.all.replications: false
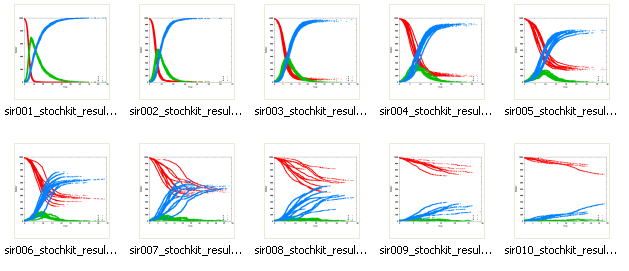
Bio-PEPA results
The Bio-PEPA workbench produces graphs showing how the numbers of the susceptible (red), infected (green) and recovered (blue) vary as a function of time, for all of the simulation runs, for each of the parameter sets.