While edges (i.e. boundaries between regions with
relatively distinct graylevels) are by far the most common type of
discontinuity in an image, instances of thin lines in an image occur
frequently enough that it is useful to have a separate mechanism for
detecting them. Here we present a
convolution
based technique
which produces an image description of the thin lines in an
input image. Note that the Hough transform
can be used to detect lines; however, in that case, the output is a
parametric description of the lines in an image.
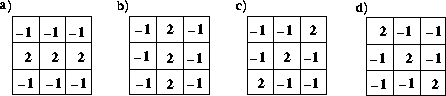
The line detection operator consists of a convolution
kernel tuned to detect the presence of lines of a particular width
n, at a particular orientation
 . Figure 1 shows a collection of four such
kernels, which each respond to lines of single pixel width at the
particular orientation shown.
. Figure 1 shows a collection of four such
kernels, which each respond to lines of single pixel width at the
particular orientation shown.
Figure 1 Four line detection kernels which respond maximally to horizontal, vertical and oblique (+45 and - 45 degree) single pixel wide lines.
These masks above are tuned for light lines against a dark background, and would give a big negative response to dark lines against a light background. If you are only interested in detecting dark lines against a light background, then you should negate the mask values. Alternatively, you might be interested in either kind of line, in which case, you could take the absolute value of the convolution output. In the discussion and examples below, we will use the kernels above without an absolute value.
If  denotes the response of kernel i, we can
apply each of these kernels across an image, and for any particular
point, if
denotes the response of kernel i, we can
apply each of these kernels across an image, and for any particular
point, if  for all
  that point is more likely to contain a line whose
orientation (and width) corresponds to that of kernel i. One
usually thresholds to eliminate
weak lines corresponding to edges and other features with intensity
gradients which have a different scale than the desired line width. In
order to find complete lines, one must join together line fragments,
e.g., with an
edge tracking operator.
that point is more likely to contain a line whose
orientation (and width) corresponds to that of kernel i. One
usually thresholds to eliminate
weak lines corresponding to edges and other features with intensity
gradients which have a different scale than the desired line width. In
order to find complete lines, one must join together line fragments,
e.g., with an
edge tracking operator.
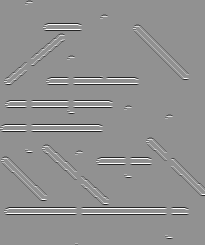
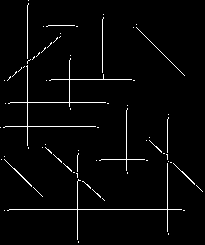
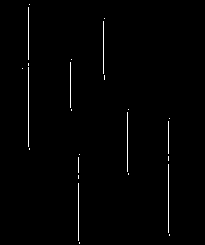
To illustrate line detection, we start with the artificial image
which contains thick line segments running horizontally, vertically and obliquely across the image. The result of applying the line detection operator, using the horizontal convolution kernel shown in Figure 1.a, is
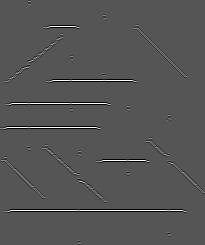
(Note that this gradient image has been normalized for display.) There are two points of interest to note here.
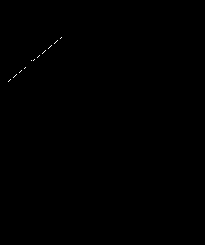
shows a zoomed region containing both features, the horizontal line detector responds to more than high spatial intensity horizontal line-like features, e.g.
This latter fact might cause us to naively think that the image which gave rise to
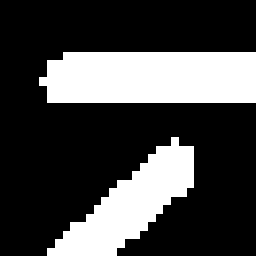
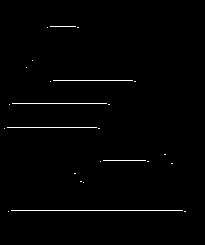
contained a series of parallel lines rather than single thick ones. However, if we compare this result to that obtained by applying the line detection kernel to an image containing lines of a single pixel width, we find some consistent differences. For example, we can skeletonize the original
(so as to obtain a representation of the original wherein most lines are a single pixel width), apply the horizontal line detector
and then threshold the result
If we then threshold the original line detected image at the same pixel value, we obtain the null image
Thus, the values corresponding
to the true, single pixel lines found in the skeletonized version
are stronger than those values corresponding to
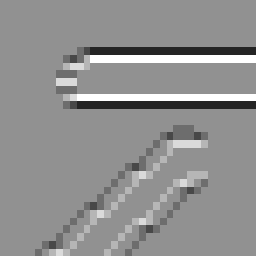
edges. Also, if we examine a cropped and zoomed
version of the line detected raw image
and the skeletonized line detected image
we see that the single pixel width lines are distinguished by a region of minimal response on either side of the maximal response values coincident with the pixel location of a line. One can use this signature to distinguish lines from edges.
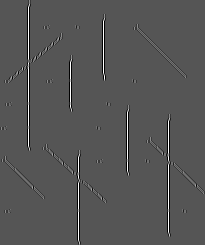
The results of line detecting (and then normalizing) the skeletonized
version of this image with single pixel width convolution kernels of
different are
for a vertical kernel,
for the oblique 45 degree line, and
for the oblique 135 degree line. The thresholded versions are
and
respectively. We can add these together to produce a reasonably faithful binary representation of the line locations
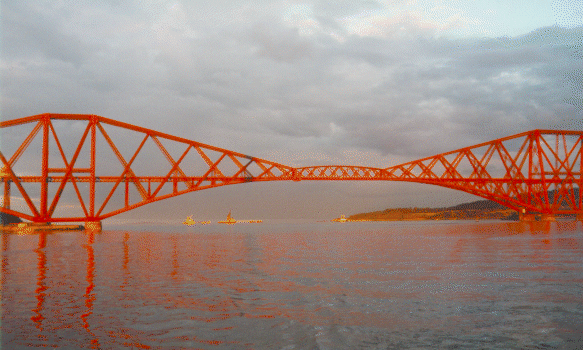
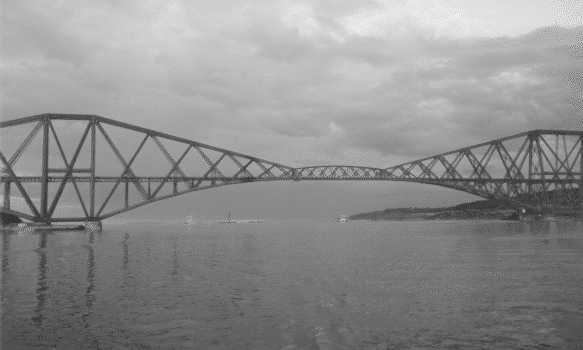
It is instructive to compare the two operators under more realistic circumstances, e.g. with the natural image
After converting this to a grayscale image
and applying the Canny operator, we obtain
Applying the line detector yields
We can improve this result by using a trick employed by the Canny operator. By smoothing the image before line detecting, we obtain the cleaner result
However, even with this preprocessing, the line detector still gives a poor result compared to the edge detector. This is true because there are few single pixel width lines in this image, and therefore the detector is responding to the other high spatial frequency image features (i.e. edges, thick lines and noise). (Note that in the previous example, the image contained the feature that the kernel was tuned for and therefore we were able to threshold away the weaker kernel response to edges.) We could improve this result by increasing the width of the kernel or geometrically scaling the image.
You can interactively experiment with this operator by clicking here.
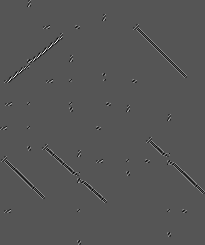
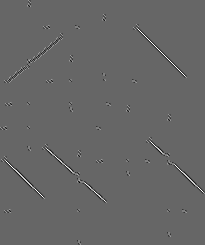
We can investigate the scale of features in the image by applying line detection kernels of different widths. For example, after convolving with a single pixel horizontal line detecting kernel we discover that only the striped shirt of the bank robber contains single pixel width lines. The normalized result is shown in
and after thresholding (at a value of 254), we obtain
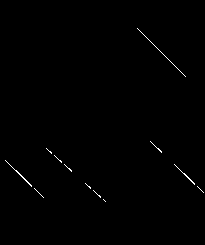
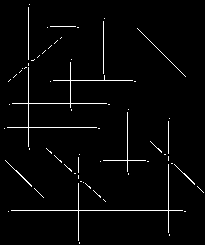
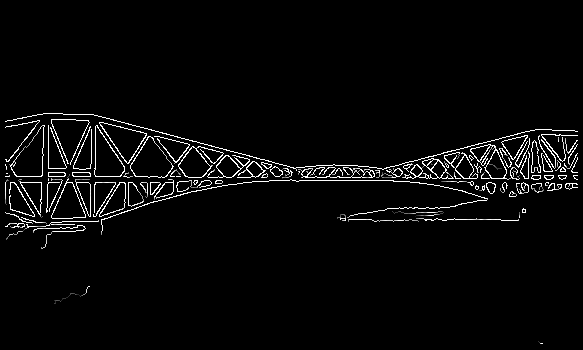
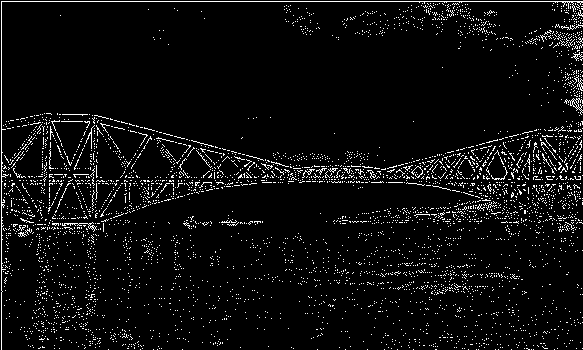
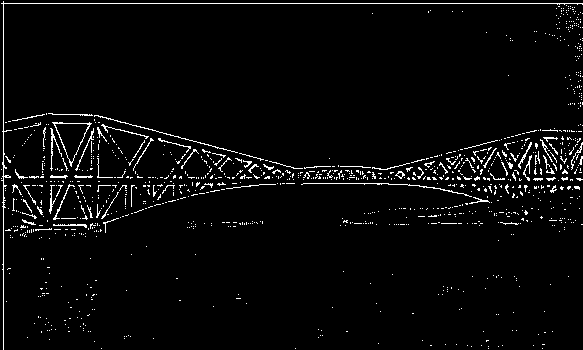
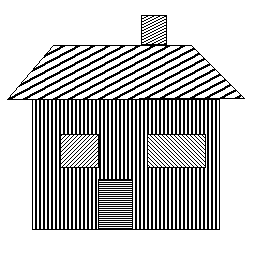
a) Perform the same analysis on the image
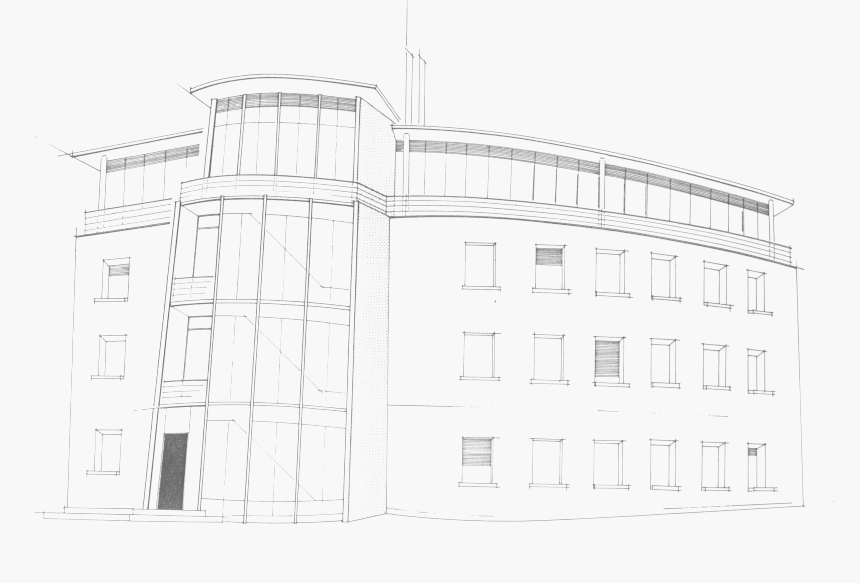
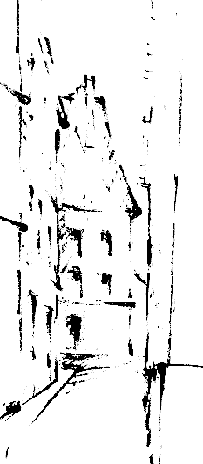
using different width kernels to extract the different features (e.g. roof, windows, doors, etc.). Threshold your result so that the final images contain a binary description of just the feature of interest. b) Try your kernels on other architectural drawings such as
and
You will most likely need to apply some smoothing as a first step and you may then want apply several different kernels and add the results together. Compare your final result with an edge detection algorithm, e.g. Roberts cross, Sobel, Compass and/or Canny edge detector.
D. Vernon Machine Vision, Prentice-Hall, 1991, Chap. 5.
R. Gonzalez and R. Woods Digital Image Processing, Addison-Wesley Publishing Company, 1992, pp 415 - 416.
Specific information about this operator may be found here.
More general advice about the local HIPR installation is available in the Local Information introductory section.
©2003 R. Fisher, S. Perkins,
A. Walker and E. Wolfart.
![]()