
Latest News
-
Multi-Omic Graph Diagnosis (MOGDx) : A data integration tool to perform classification tasks for heterogenous diseases
Barry Ryan , Riccardo Marioni and T. Ian Simpson
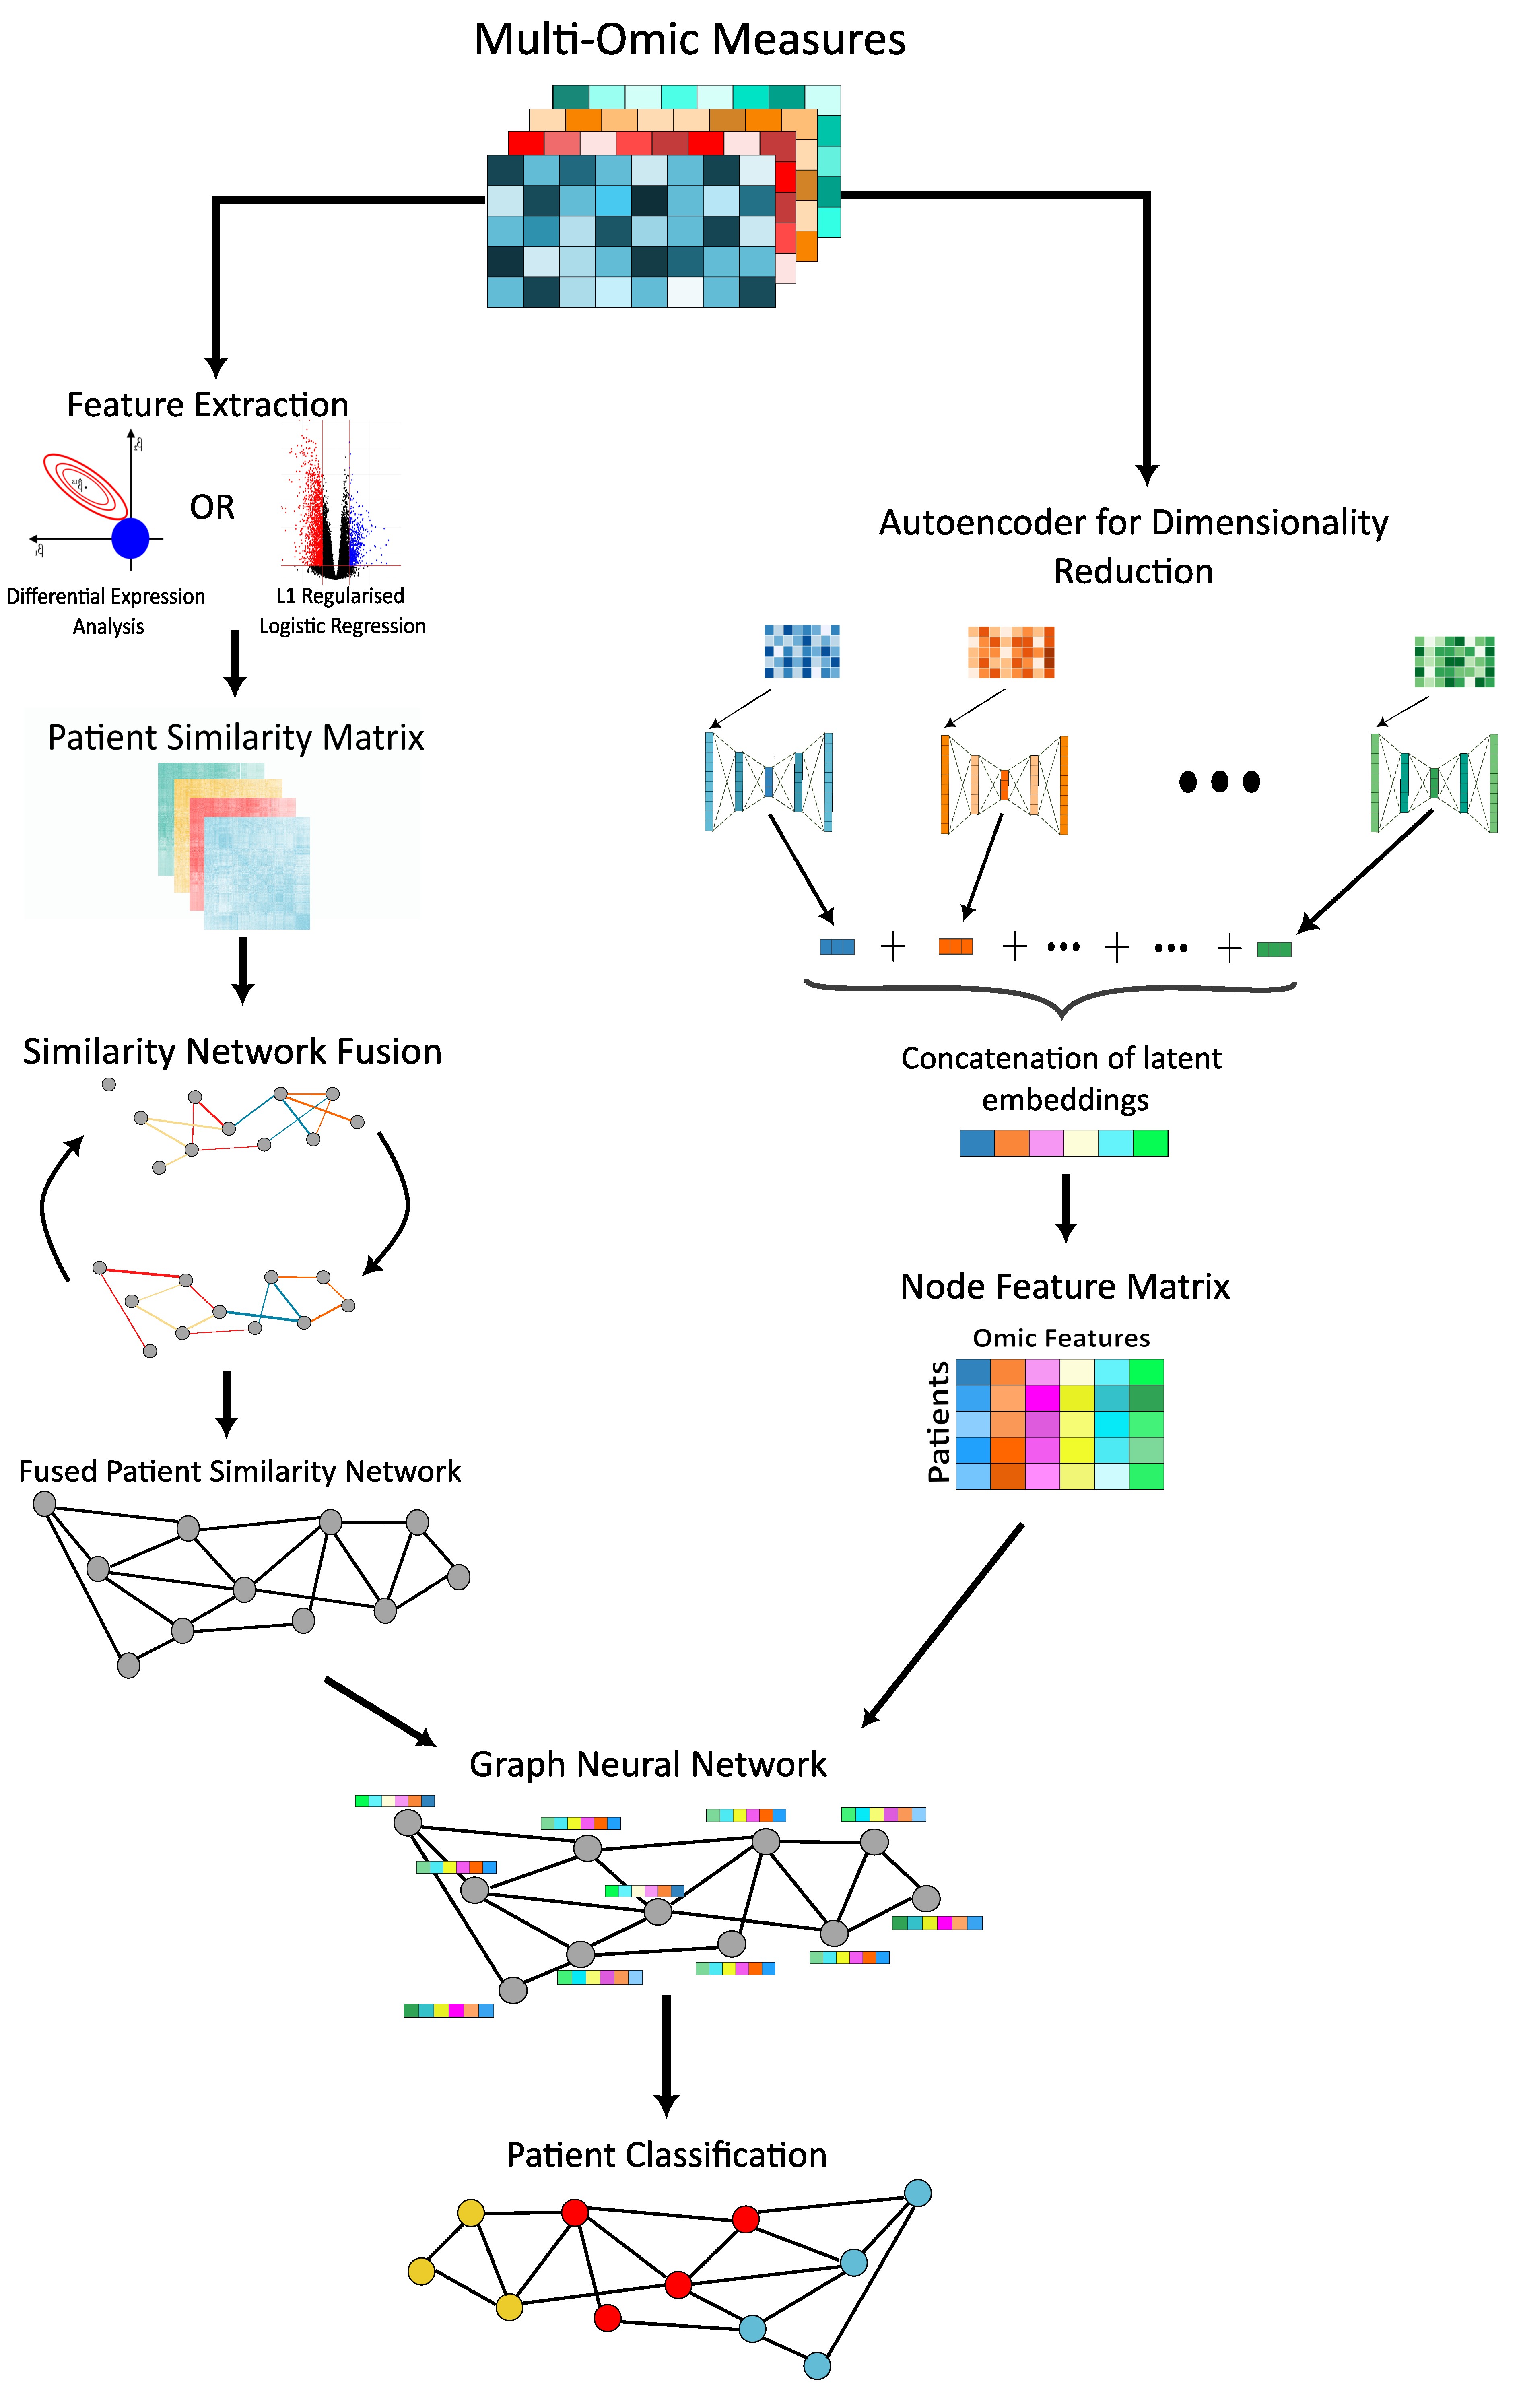
Heterogeneity in human diseases presents challenges in diagnosis and treatments due to the broad range of manifestations and symptoms. With the rapid development of labelled multi-omic data, integrative machine learning methods have achieved breakthroughs in treatments by redefining these diseases at a more granular level. These approaches often have limitations in scalability, oversimplification, and handling of missing data. In this study, we introduce Multi-Omic Graph Diagnosis (MOGDx), a flexible command line tool for the integration of multi-omic data to perform classification tasks for heterogeneous diseases.
MOGDx incorporates a network taxonomy for data integration and utilises a graph neural network architecture for classification. Networks con be easily integrated, can readily handle missing data, and have been used in a wide variety of biomedical applications in the unsupervised setting. Graph Neural Networks (GNN) have shown powerful classification performance on several benchmark network datasets. The use of GNN's in a supervised setting for disease classification is a promising avenue to redefine heterogenous diseases.
The performance of MOGDx was benchmarked on three distinct datasets from The Cancer Genome Atlas ([TCGA](https://www.cancer.gov/ccg/research/genome-sequencing/tcga)) for breast invasive carcinoma, kidney cancer, and low grade glioma. MOGDx demonstrated state-of-the-art performance and an ability to identify relevant multi-omic markers in each task. It did so while integrating more genomic measures with greater patient coverage compared to other network integrative methods. MOGDx is available to download from [Github](https://github.com/biomedicalinformaticsgroup/MOGDx).For more information find the preprint to our paper online here
-
Network based approach to identify sub-populations within Parkinson's Disease
Barry Ryan (e-mail) is a PhD student from the CDT in Biomedical Artificial Intelligence working in the group on network based approaches in biomedicine, specically aiming to integrate multi-modal data to improve our understanding of neurological disease.
Abstract
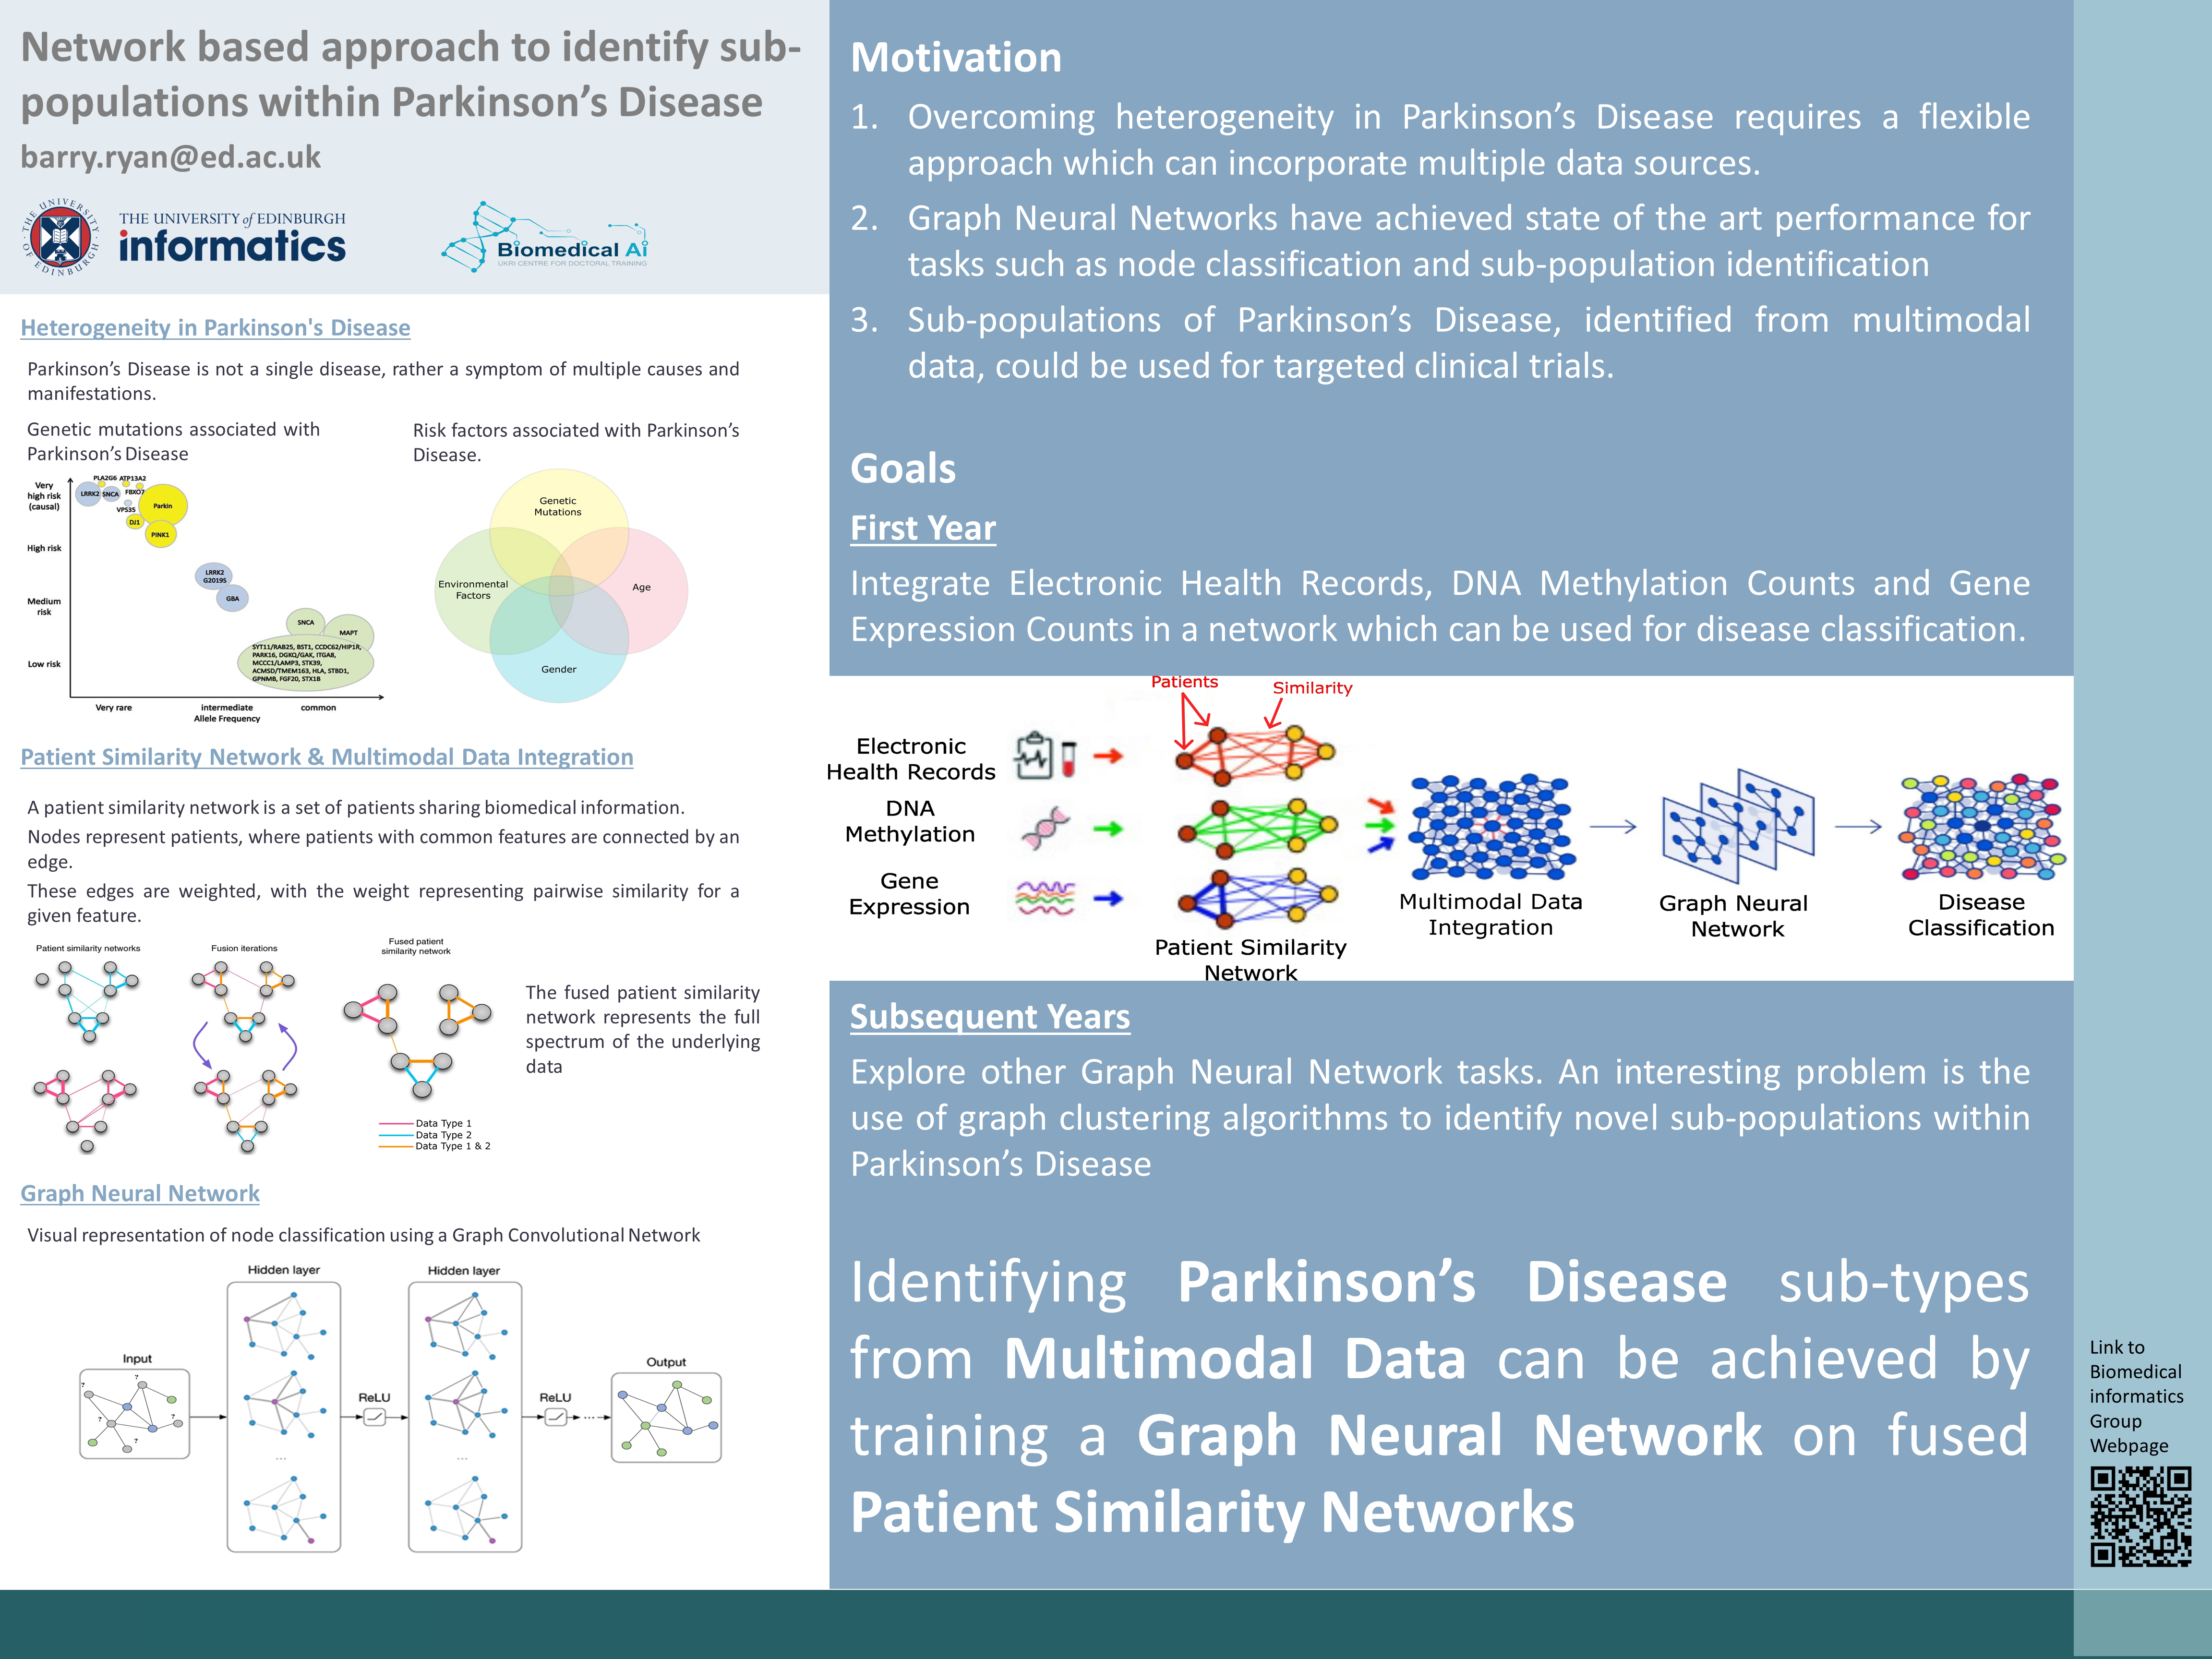
Precision medicine is a term coined to describe the movement of medicine towards a personalised preventative approach compared to current reactionary practices. Diseases, individuals and environments are diverse, however current medical practice looks to group together common symptoms under a single disease. Precision medicine seeks to move away from this and identify common causes and manifestations of diseases which pre-date symptoms thus, facilitating preventative treatments. Central to the development of precision medicine is therefore the integration of genetic, environmental and lifestyle data for accurate disease classification.
Networks are all around us. A computer network is a set of computers sharing resources located on network nodes. A social network, such as Facebook or Twitter, is a set of humans sharing information such as photos and posts with each other. A patient similarity network (PSN) is a set of individuals sharing medical information in an attempt to identify commonalities or similarities within a disease. PSN's can be used to integrate multi-modal data sources to classify patients in an interpretable manner (Pai and Bader 2018). In theory, a PSN could be used to; identify novel genetic mutations, improve the understanding of the pathology of disease, improve candidate selection in clinical trials and identify individuals who are at a higher than average risk of a disease.
Parkinson’s disease (PD) is a heterogeneous disease with multiple causes and manifestations many of which remain unknown (Dextera and Jenner 2013). Currently therapies are aimed at relieving symptoms of PD rather than addressing the underlying causes. While genetic causes have been shown to account for 30% of cases, much about the pathology of the disease remains unknown (Klein and Westenberger 2012). Furthermore, common biological pathways between genetic and idiopathic (no known genetic cause) PD only converge late in the disease course. Other previous research has found associations with genetic, environmental and lifestyle factors and PD. For these reasons, PD is a perfect testing ground on which to test a network-based approach for precision medicine.
-
SFARI Genes and How to Find Them
We recently published an article in Scientific Reports based on work by Magdalena that studied the relationship between gene expression profiles of patients with Autism Spectrum Disorders and their status as genes already identified as having a role in the development of ASDs. Put simply, do these genes have expression features that we can learn so that we can build models to identify potential novel ASD causative genes? In this paper we show that, despite the signal being quite weak, there is information that we can leverage from high throughput gene expression studies to give us indications of new genes for ASD. Interestingly, in order to find this signal Magdalena had to integrate gene exrpression profiles across the entire expression landscape by creating weighted gene correlation networks. Only by sharing the information across the whole system was it possible to develop an informative statistical model for candidate prioritisation.
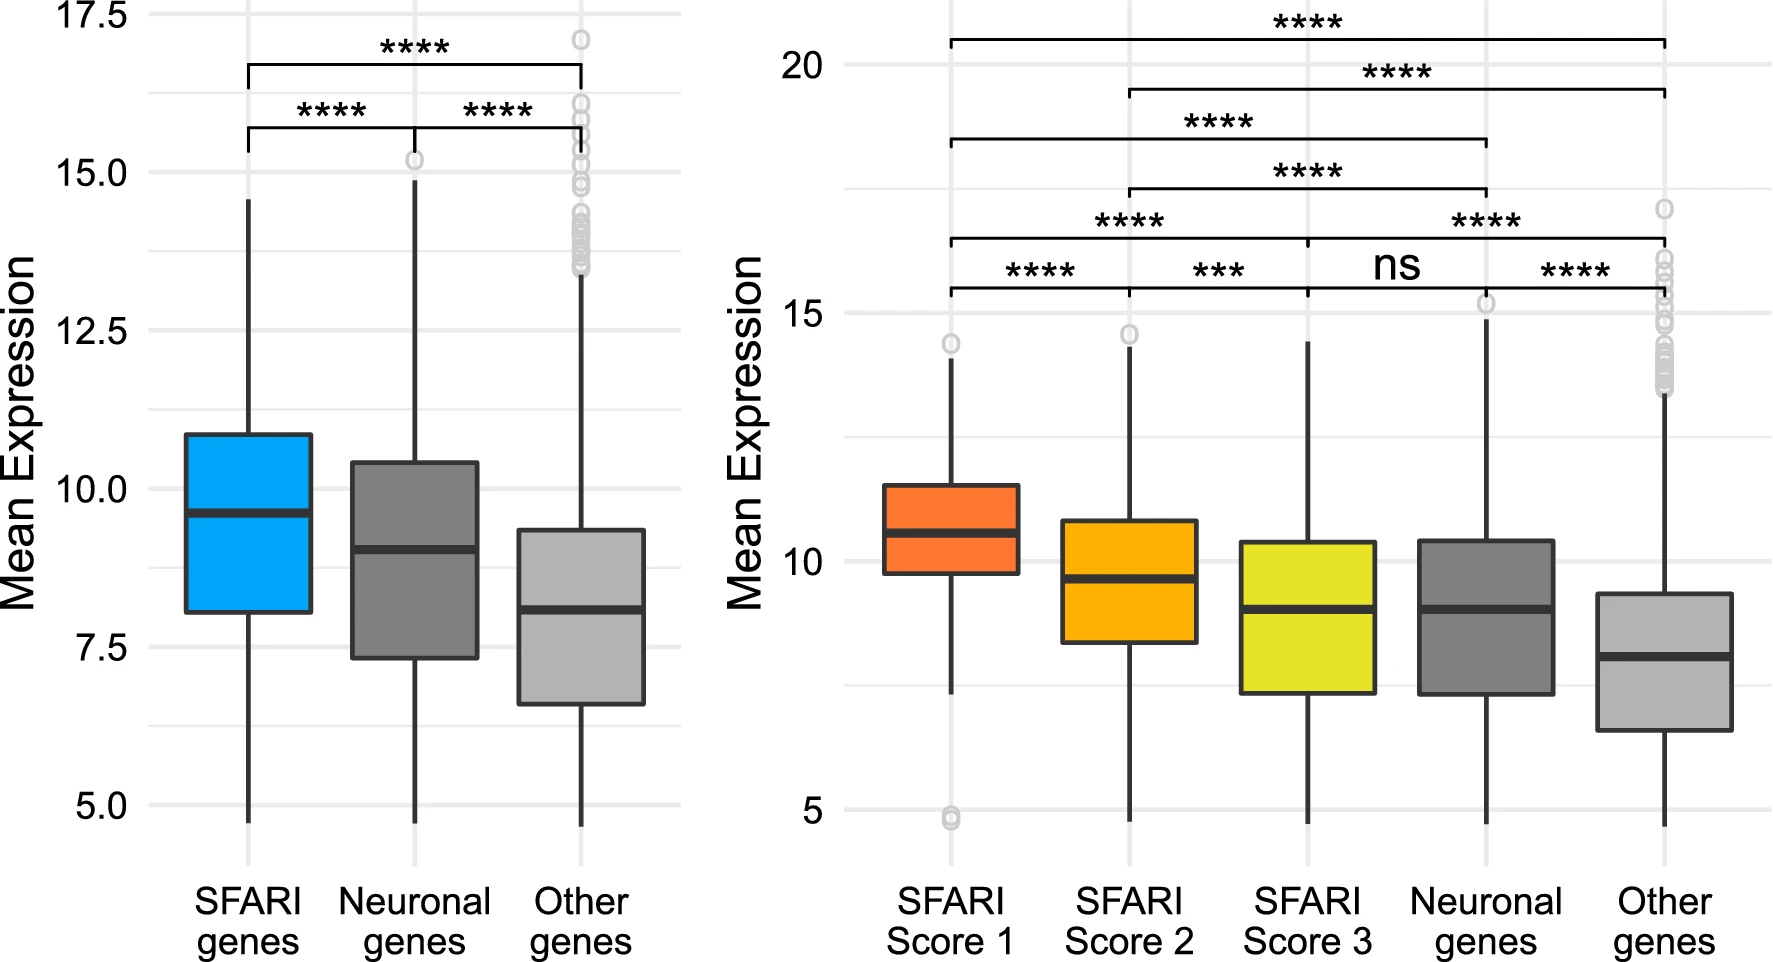
SFARI genes have higher levels of expression than other genes. Comparison between the SFARI genes, genes with neuronal annotations and with the rest of the genes in the dataset. The brackets at the top indicate pairwise comparisons, using a Welch t-test to study wether the differences in level of expression between groups are statistically significant, and the asterisks indicate the magnitude of the corrected p value of each test: ns = p value ≥ 0.05, *p value < 0.5, \*\*p value < 0.01, \*\*\*p value < 0.001, and \*\*\*\*p value < 0.0001. (A) SFARI genes. (B) SFARI Scores. Outlier genes are represented individually as open circles. The t-tests use all the points in each group, including outliers.